

This study addresses the issue of content consumption in Basque. In order to clarify the relationship between both variables, the models of content consumption in Basque are analyzed in sociolinguistic areas. In addition, another sub-strategy is proposed: to analyze the evolution of media consumption in Basque society in the last 25 years (1997-2022).
1. INTRODUCTION
In recent decades, numerous studies have been carried out on the use of Euskera, aimed at measuring oral use in different sociolinguistic contexts. However, although so far studies have been carried out on the consumption of media content in Basque (for example, by the hand of Behstrategy), the knowledge or use of Basque has not focused on such a systematized and institutionalized research. This study will analyze the consumption of Basque media in the Autonomous Community of the Basque Country (CAPV) and in the different sociolinguistic areas of Navarra.
1.1. THE ROLE OF MEDIA PROVISION IN MINORITY LANGUAGES
Understanding the relationship between the media and ethnolinguistic identity is essential to analyze the influence of the media on linguistic minorities. Ethnolinguistic identity plays an important role in determining the use of the media among linguistic minorities (Moring and Vincze, 2011). It serves as a motivating factor and influences the consumption patterns and priorities of individuals. However, it is important to note that other factors influence. To explain the influence of the supply factor on the consumption of minority language media, one can take into account the example of the Finnish Swedish language community developed by researchers. Although it accounts for only 8% of the population, this linguistic minority receives great institutional support: the media landscape that serves it is very rich; it has eight newspapers, two radio stations and a Swedish television channel (Moring and Vincze, 2011). Consequently, Finnish Swedish speakers have almost all the institutional resources in Swedish. Although ethnolinguistic identity serves as a motivating factor for media consumption, the supply factor plays a fundamental role in shaping the linguistic character of media use. The example of the Finnish Swedish language group underlines the importance of a comprehensive media landscape that meets the needs of linguistic minorities.
1.2. MEASURING THE USE OF EUSKERA
1.2.1. LINGUISTIC USE BEYOND STREET USE
The Sociology Cluster makes an annual measurement of the use of Euskera. This measurement is carried out through street observation, so the use is limited to street conversations. The use of a language is a multidimensional and complex phenomenon that encompasses more than the number of people who speak. The ability to read, learn or listen to music in a language reflects the vitality and importance of the culture of that language, and demonstrates its use in different everyday contexts and activities. Therefore, measurement limited to oral use is not enough to portray the linguistic use of society. This study proposes a broader and more precise view of the use of Euskera, which takes into account not only the number of people who speak, but also the consumption of the media in Euskera. However, the problem with this methodology is that the media audience database to be used is conditioned by the advertising sector. In short, this sector finances large-scale audience research. This excludes the most important variable of the research, the use of language, which is not limited to mere comprehension, but includes its active and participative use in society. Therefore, to measure the real use of Euskera, a deeper and more precise approach is needed, taking into account not only the number of people who speak, but also their presence in different contexts and daily activities.
2. METHODOLOGY
2.1. OBJECTIVES
At a time when audiovisual content becomes so important in human relations, it is important to parameterize the consumption being made and measure the use of Euskera from different foci. It is interesting to investigate to what extent the environment influences the individual"s attitudes and actions. Specifically, regarding the theme, it is interesting to investigate whether the use of Euskera varies according to the main language of the area. Thus, combining the two previous gaps, this study analyzes the consumption of contents in Basque by sociolinguistic areas, in order to help clarify the relationship between both variables. In addition, this study aims to analyze media consumption in Basque society and its evolution over time (specifically in the last 25 years). The interest of this study lies in the importance of the media to transmit and strengthen the language in society. It is intended to know whether media consumption in Basque tends to increase or decrease, as well as identify the factors that influence such consumption.
2.2. TECHNIQUES
This study will use primary (CIES, Eustat) and secondary (written by others) sources. For the generation of first level quantitative data, the CIES databases have been used and data from 1997 to 2022 have been exploited using the TOM Micro tool to investigate consumption in Basque and its evolution in the last 25 years. For the construction of the variable that measures media consumption in Basque, only “consumption of the previous day” has been taken into account, excluding the consumption of magazines. Therefore, four of the five CIES measuring media will be used: radio, press, digital press and television. This consumption in Euskera has been compared with the knowledge of Euskera, using the CIES variable “speaks in Euskera, lee, understand”. On the other hand, the Euskaldunes figures for each region for the creation of socio-linguistic areas were obtained from Eustat (for CAPV data) and the CIES (for Navarra data). Finally, regarding the number of sociolinguistic areas, although the Vice-Ministry of Language and Politics divides them into four strata, in this research ten strata will be generated with the objective of obtaining more discriminatory results. For the development of information from both databases, cross-sections have been performed. No data fusion or exhaustive statistics were used. In this methodology there is a main limitation. This research excludes all content consumption generated on streaming platforms, social networks or websites such as YouTube. This is what happens because the CIES mainly measures audiences of traditional media: radio, press, digital press, magazines and television. Although the CIES measures consumption on the Internet, it is not specified whether the content is in Basque, so it is out of the analysis. In addition, specific consultations have been held with the Basque Media Observatory and other members of the NOR Research Group.
3. DATA ANALYSIS
3.1. PERCENTAGE OF THE POPULATION THAT HAS CONSUMED SOMETHING IN EUSKERA IN THE LAST 25 YEARS (1997-2022)
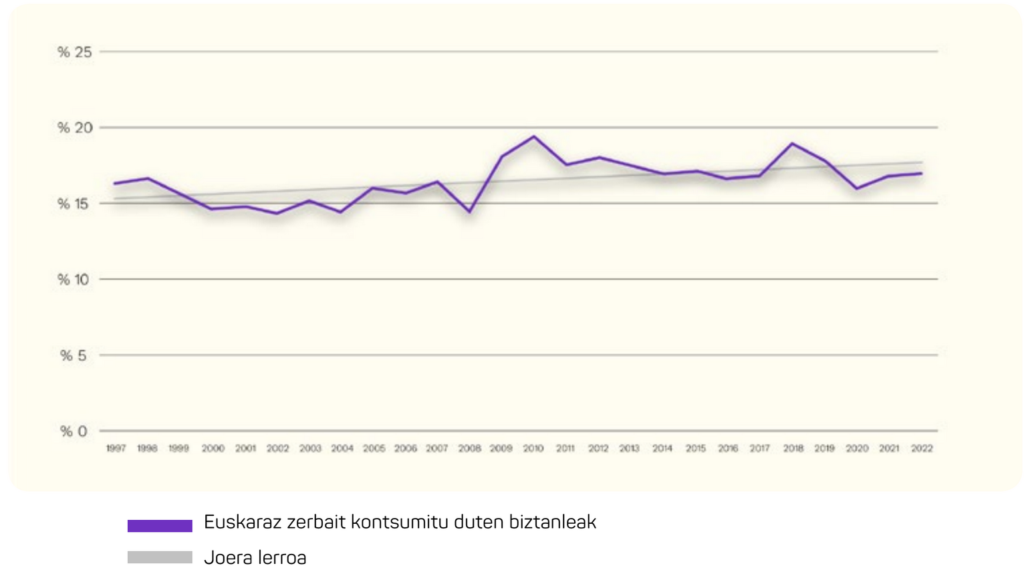
The percentage of the population that consumed something in Basque between 1997 and 2022 has remained virtually the same, only increased by 0.6%. However, in view of the trend line of the last twenty-five years, it can be said that consumption in Euskera is growing gradually.
Figure 1: Percentage of the population that consumed something in Basque (1997-2022).
 Source: own production from CIES data, 2023.
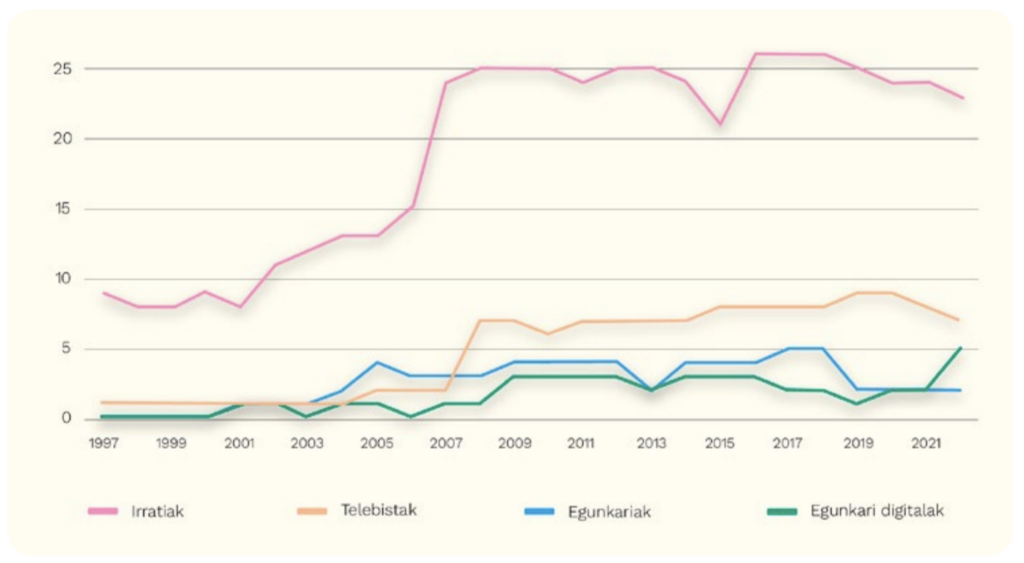
To delve more deeply into this first topic analyzed, below is a graph showing the evolution of the number of media in Basque.
Figure 2: Number of media in Basque Country by media type (1997-2022).
 Source: Own elaboration based on CIES data, 2023.
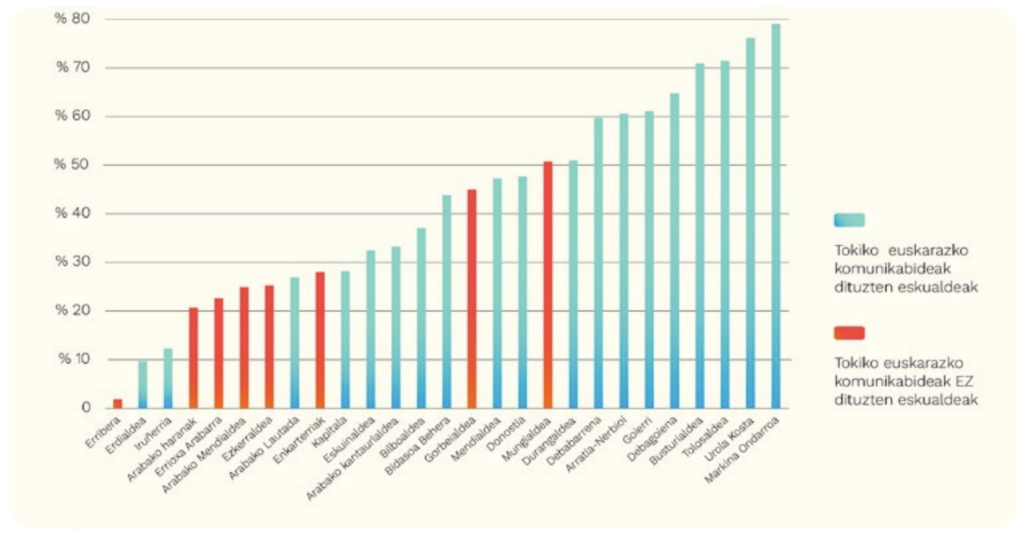
The trend is clear. In total, the number of Basque media has tripled, from 11 in 1997 to 37 today. However, it should be remembered that although CIES measures 37 media in Basque, Behstrategy has 127 media identified in 2023. The four supported media (radio, press, digital press and television) show a positive trend. Radios are the most widespread media in Basque and digital newspapers are minorities. Given that many actions are being carried out in favour of the normalization of the Basque country, there are counties that have created the local media. In particular, they are the most Euskaldunes, that is, those with a high density of Euskaldunes. The existence of a solid base of Basque speakers offers a receptive audience wanting to consume content in the mother tongue. This linguistic demand can encourage media professionals to create new media in Basque, whether newspapers, magazines, radios, television networks or network platforms. Moreover, the high density of Euskaldunes can also affect the diversity and quality of new media in Basque. The greater the community of speakers, the greater the number of professionals trained in the production of content in Basque. This may result in more production of themes and media, so Euskaldunes who want to communicate in Basque do not need to resort to other media in Spanish or English. The following graph shows that the density of Euskaldunes favors the creation of media in Basque, since almost all counties with a density greater than 30% of Euskaldunes have local media in Basque:
Figure 3: Regions with Euskaldunes density and local media (in blue).
 Source: Research Group NOR, 2023.
3.2. EVOLUTION OF THE BASQUE KNOWLEDGE (1999-2022)
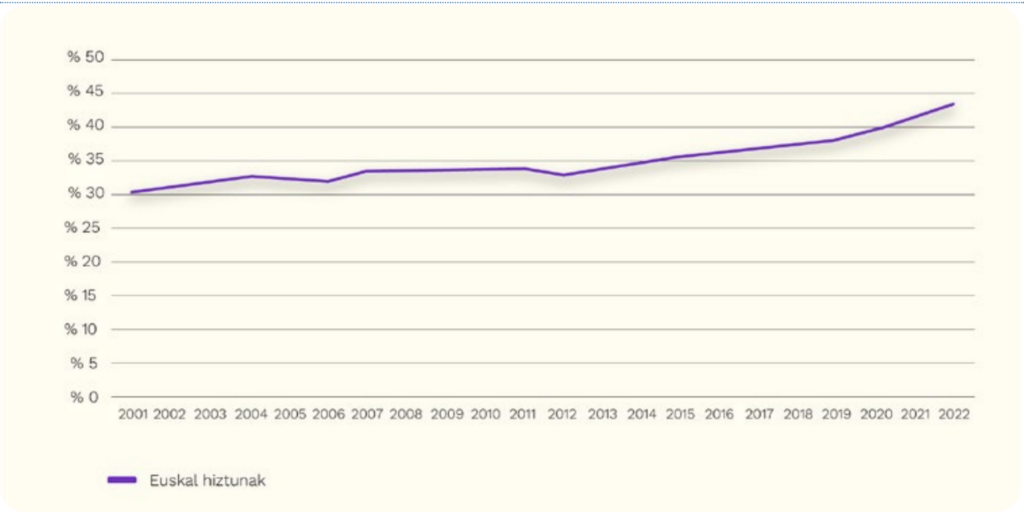
Another important factor in the investigation of consumption in Basque is the knowledge of Basque. The following graph presents the evolution of Basque knowledge in the last 25 years:
Figure 4: Percentage evolution of Basque knowledge (2001-2022).
 Source: Own elaboration based on CIES data, 2023.
Overall there has been a positive change, in most regions the density of vascospeakers has increased over the past 20 years (table). Moreover, it is noteworthy that the density of vasco-speakers influences the change. In particular, regions with lower density of Basque speakers have increased further. For example, the Commissions have risen 20 points, from 9% in 1996 to 29% in 2016. The regions with the highest increase are Encartación (20 points), Montaña Alavesa (18 points) and Valles Alaveses (16 points). Conversely, the increasing density of vasco-speakers in Basque counties decreases in most cases. On the contrary, the formula is not maintained in the areas of Navarra. The regions with the lowest increase are Ribera (0 points) and Tolosaldea, Alto Deba and Navarra Media (2 points). The 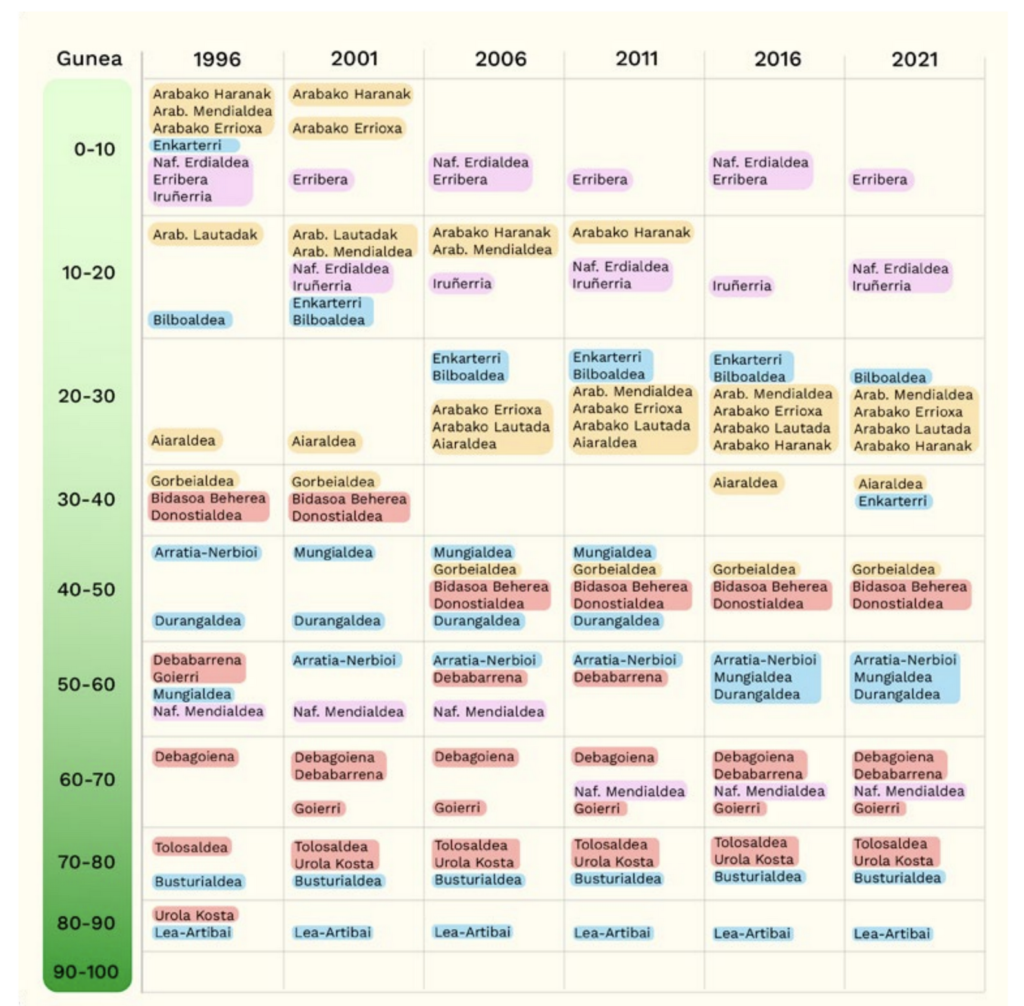 following maps have been developed to understand these changes in a more visual and consequently more friendly way.
3.3. PERCENTAGE EVOLUTION OF CONSUMPTION IN THE BASQUE COUNTRY AMONG THE SPEAKERS (2001-2022)
The evolution of consumption in Basque and of knowledge in Basque has been measured. Taking this into account, the evolution of the vasco-speakers has crossed with the consumption of the media in Basque to know the consumption of the vasco-speakers.
Figure 5: Consumption of Basque content among Basque speakers (2001-2022).
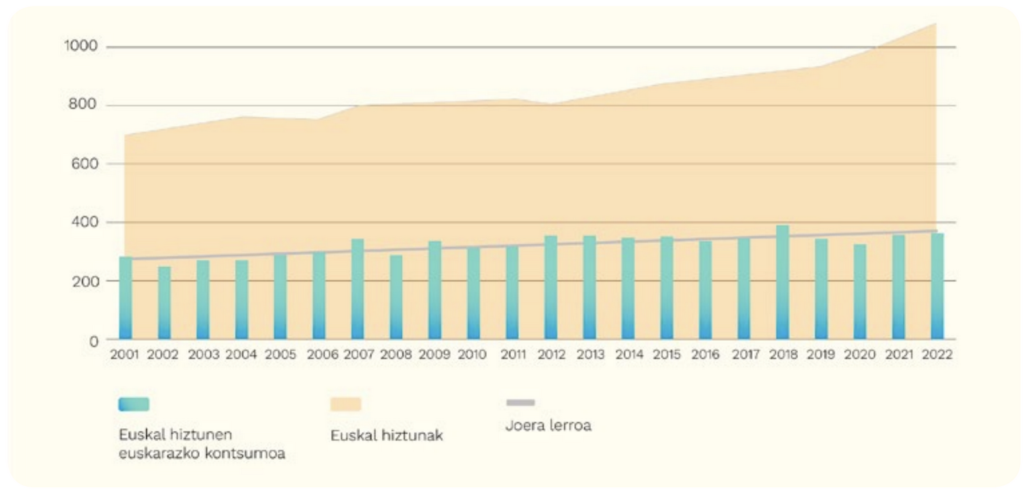 Source: Own elaboration based on CIES data, 2023.
The understanding of this graph allows to highlight several ideas. First, 37% of vasco-speakers have consumed Basque content from 1997 to 2022, but in those years there has been a decrease of 9.4%. However, in absolute terms, it is observed that the audience figures are maintained in a similar way. This does not mean that Basque consumption is maintained. In fact, it is observed that the number of vasco-speakers has increased considerably in the last twenty-five years. With these two data, it is deduced from the graph currently consumed more than in 1997, in absolute terms. However, if we take into account the increase in Euskaldunes, the percentage of Euskaldunes they consume decreases: In 1997 it was 40.1% and in 2022 it was 30.7%. This explains that despite the increase in the number of Euskaldunes, they do not consume in Basque, so the number of Euskaldunes they have consumed in Basque is proportionally lower.
3.4. TRENDS IN CONSUMPTION IN THE BASQUE COUNTRY IN THE DIFFERENT SOCIO-LINGUISTIC AREAS (1997-2022)
After analyzing the global media consumption in Basque, the consumption of each socio-linguistic area is analyzed below. This permits knowing the situation and concrete evolution of each of the spaces, in order to analyze the impact that coexistence in one or another space can have on the consumption of the media in Basque. That is to say, this is how it will be seen if a Basque Speaker, mostly in an erdaldun area, consumes more or less content in Basque than a Basque surrounded by other Basques.
Figure 6: Consumption in Basque in different sociolinguistic areas and years (1997-2022).
 Source: Own production from CIES data, 2023
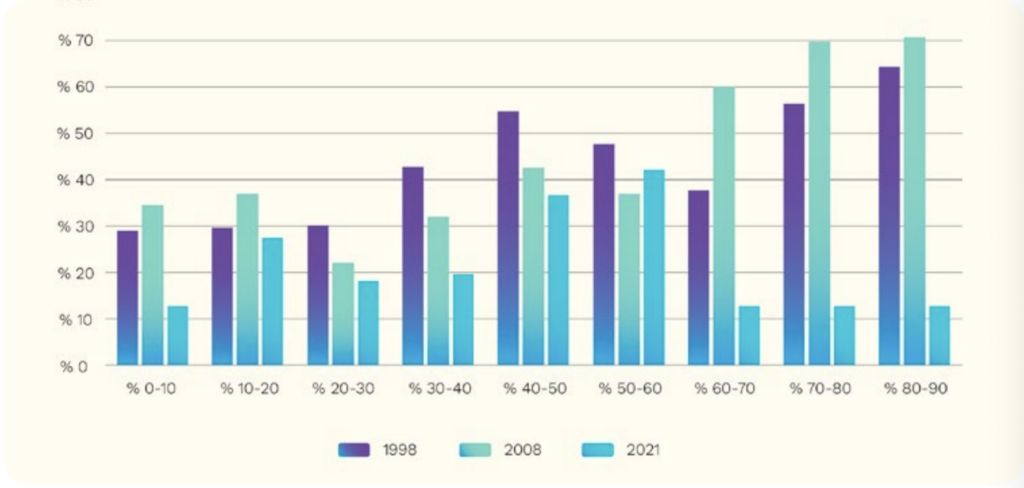
This graph represents the focus on the differences between the different foci. The first result that can be extracted from this graph is that in areas with higher density of vasco-speakers more is consumed in Basque. In other words, Vasco-speakers living in more Castilian and Spanish regions consume less content than Vasco-speakers living in more Basque regions. This may be due to the fact that vascospeakers from the most Castilian speaking areas may be Euskaldunberris, and in general they use less language (Socio-linguistic Survey, 2021).
3.5. MEDIA CONSUMPTION IN DIFFERENT SPACES ACCORDING TO SOCIOLINGUISTIC AREAS
Figure 7: Measuring media consumption in their space, as a percentage (1997-2019).
 Source: Own production from CIES data, 2023
To create the graph above, data from 1997 to 2019 have been taken and the average of them has been obtained. Data are shown until 2019, as the variables of the communication spaces of the following years have not been obtained. Focusing on the results, the following should be highlighted: First, compared to the consumption of the autonomous or national media, it is found that the consumption of state media is double. In other words, Hego Euskal Herria consumes mainly state media.
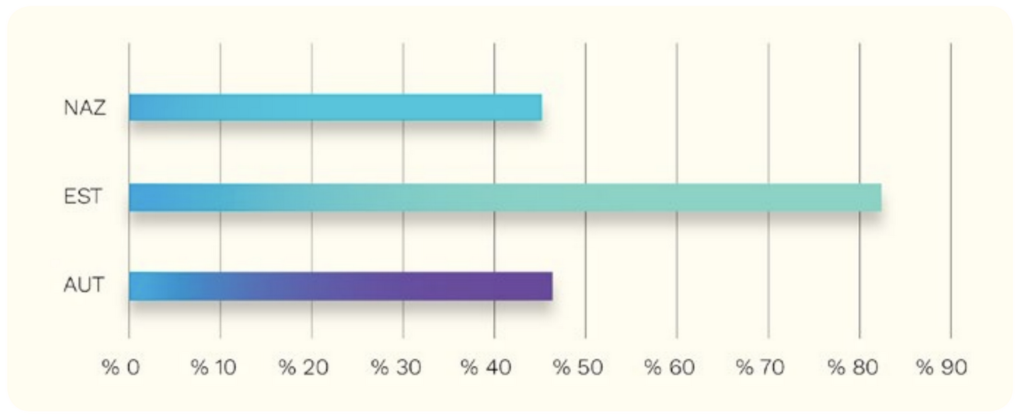
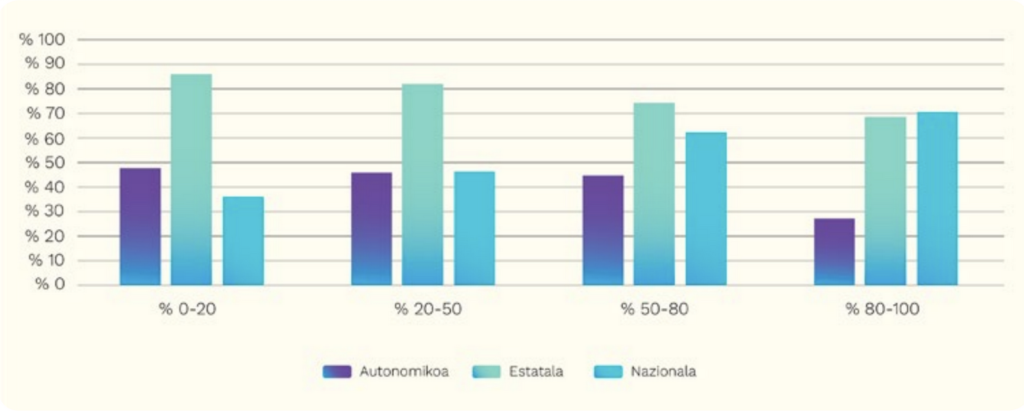
Figure 8: Consumption by media outlets in socio-linguistic areas (X, %).
 Source: Own elaboration based on CIES data, 2023.
According to this graph, the state media are the most consumed in the four nuclei, but it is noteworthy that the national media are increasingly consumed as the density of the Basques is higher. Because ultimately, nationals are consumed a little bit more than state nationals. Regarding the autonomic ones, the graph shows that the density of vascospeakers is decreasing, the higher the consumption.
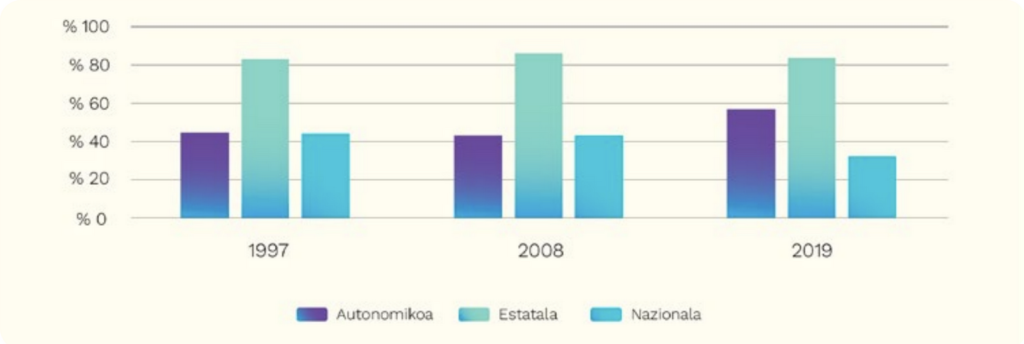
Figure: Evolution of media consumption by measuring space in percentage (1997-2019).
 Source: Own elaboration based on CIES data, 2023.
To continue, in view of its evolution, it should be noted that during these years (1997-2019) there have been changes, mainly in the consumption of the autonomous media, which have increased by 11.44%. State media consumption was maintained with an average consumption of 82.47%. And finally, the consumption of national media has remained very similar, with a consumption of 45.31%.
4th. CONCLUSIONS
First, it should be noted that the percentage of the population that has consumed something in Euskera in the last 25 years has remained practically the same, with a percentage increase close to 0.6%, although in absolute terms it is more significant. This does not correspond to the increase in the number of media in Basque, which in this period has tripled. Secondly, the data show that radios are the most generated media in Basque, while digital newspapers are minority. However, the four media studied (television, radio, press and digital press) have had a positive trend in the last 25 years. Thirdly, the number of vasco-speakers has increased over the past 25 years, from one quarter to almost half of the population. Overall, this change has been positive, as vasco-speaker density has increased in most regions over the past 20 years. Fourthly, despite the increase in the number of Euskaldunes, that is, the number of Basque speakers, this increase has not led to a proportional increase in media consumption in Basque. Therefore, although there are more and more Euskaldunes, the proportion of Euskaldunes that consume in Euskera has been decreasing. Fifthly, Hego Euskal Herria consumes mostly state media. On the contrary, despite the increase in the Basque media, nationals are increasingly consumed only in those regions where the density of Euskaldunes is increasing. This suggests that, although the presence of the Basque country is increasing, there is still a priority for the Spanish media. Finally, there is a higher consumption of Basque in the socio-linguistic areas with higher density of Basque speakers. This means that the normalization of Euskera is more advanced in some areas than in others, and that the density of vasco-speakers is an important factor in media consumption in Euskera. In summary, the data collected show that, although the number of Euskaldunes and media in Basque has increased, this increase has not led to a proportional increase in media consumption in Basque. The preference for Spanish media remains high in some areas, and the density of Euskaldunes is a determining factor in media consumption in Basque. The main objective of this study is to contribute to clarify the consumption of contents in Basque and the relationship between sociolinguistic areas, specifically, to measure the impact of the linguistic reality of the environment. And, after the analysis and interpretation of the data, it is clear that the focus should not be on the influence of the erdality of the environment, but on the relationship between consumption and density. Following on from the latter, the main conclusion is now drawn. In the high-density regions of Euskaldunes there is a tendency to have more local media in Euskera. It is known that the high density or critical mass of a group facilitates the creation and promotion of activities of interest to that group, as demonstrated by Vincze and Moring with Finnish Swedish speakers (Vincze and Moring, 2011). This justifies the existence of more media in Basque in those regions where the density of Euskaldunes is high. After this review, the main conclusion of this study is that the density of Basque speakers in the area is related to the number of content offers in Basque, and this accessibility is related to the consumption of Basque speakers in Basque. The key is not, therefore, that the level of erdality of the environment influences consumption in Euskera, but that the Basque context favors the supply of media in Euskera, which affects higher consumption in Euskera, given that the supply is higher.
5. BIBLIOGRAPHY
Amezaga, Josu (2017). “The importance of the communication space facing the challenge of citizenship”. How to create a common communication space in the Basque Country? Ezkerraberri Foundation, 14-49. Available in https://issuu.com/ezkerraberrifundazioa/docs/liburua_3.0
Amezaga, Josu; Arana, Edorta and Azpilwaukee, Patxi (2012). Basque media. Leioa: UPV/EHU Editorial Service. Available in https://www.teknopata.eus/wp-content/uploads/2012/02/Euskarazko_hedabideak.pdf
Observatory. (unpublished). Database: Media map [Data set]. Retrieved 22 February 2023. Available in http://datutegia.behategia.eus/hedabide/mapa
Belmar, Guillem and Glass, Maggie (2019). “Virtual communities as breathing spaces for minority languages: Re-framing minority language use in social media”. Adeptus. https://doi.org/10.11649/a.1968
times2. (d.g. ). Komunikabideak. Retrieved 16 March 2023. Available in https://cies2.com/es/que-hacemos/audiencia-de-medios
Eustat.eus. (d.g) Definitions: Linguistic competence. Retrieved 6 April 2023. Available in https://eu.eustat.eus/estadisticas/tema_458/opt_0/tipo_5/temas.html
Eustat.eus (d.g. ). Sociolinguistic maps. Retrieved 7 December 2022. Available in https://eu.eustat.eus/estadisticas/tema_232/opt_1/ti_mapa-soziolinguistikoa/temas.html
Fishman, Joshua A. (1991). Reversing language shift: Theoretical and empirical foundations of assistance to threatened languages. Clevedo: Multilingual Matters.
Stop. (2011). What are the respiratory areas? Retrieved 12 December 2022: https://blogak.eus/garaigoikoa/zer-dira-arnasguneak
Learning Institute: Nachhilfe & Sprachkurse. (17/03/2017). Measuring Linguistic Vitality - An Introduction. YouTube. Retrieved 10 December 2022. Available in https://www.youtube.com/watch?v=8Iw81WgQR20
Moring, Tom, Charles Husband, Catharina Lojander-Visapää, Laszlo Vincze, Joanna Fomina, and Mänty of Nadja Niemin. (2011) “Media use and Ethnolinguic Vitality in bilingual communities”. Journal of Multilingual and Multicultural Development, 32(2):169–86. just: 10.1080/01434632.2010.541918
Nastat Zoning. (d.g). Retrieved 6 April 2023. Available in https://nastat.navarra.es/es/servicios/zonificaciones
Research Group NOR. (2020). “Proposal of a system for measuring media coverage in Basque”. [Working document]. Leioa: UPV/EHU
Salces-Mayor, Gorka and Amezaga Josu. (2016). “Mediacentric spaces and physical spaces in minority language use: A case study on the Basque language press”. Catalan Journal of Communication & Cultural Studies, 8(2), 227–243. https://doi.org/10.1386/cjcs.8.2.227_1
Sociolinguistic cluster. (2021) Street measurement of language use. Basque Country, 2021. Retrieved 23 January 2023, available in https://soziolinguistika.eus/eu/proiektua/hizkuntzen-erabileraren-kale-neurketa-euskal-herria-2021-2/
Portal de Tolosaldea. (19 May 2014). Mikel Zalbide: Respiratory spaces of the Basque Country [Online video file]. YouTube. Retrieved 12 December 2022: https://www.youtube.com/watch?v=LbGHkeWFhLs
Zabaleta, Iñaki, Gutierrez, Arantza, Ferré-Pavia, Carmé, Fernández, Itxaso and Xamardo, Nicolás. (2019). “Facts and transformations in European minority language media systems amid digitalization and economic crisis”. International Communication Gazette, 81(3), 235-258. https://doi.org/10.1177/1748048518754749
Zuberogoitia, Aitor; Bidegain, Eneko; Egaña, Txema; Gostin, Andres and Larrañaga, Ainhoa. (2015). “The media in Basque: what the data shows.” Euskera, 60(2), 673-698. Bilbao. Available in https://www.euskaltzaindia.eus/dok/euskera/80517.pdf