

In line with the studies conducted for the previous Yearbooks, one more year we have analyzed the analytics of Hekimen websites. In 2020, 40.8 million sessions were awarded on Hekimen websites, 43% more than the previous year. The pandemic has also influenced digital media consumption in Basque. We have distributed the data by type of media and compared them with other websites to contextualize the evolution of the Basque media.
1. Introduction
The year 2020 has obviously been a special year. The pandemic has affected virtually all areas and digital media consumption has been detected.
As in previous years, this study will review the analytics of Hekimen websites. For this purpose, we have worked on the data from Hekimen Analytics (HA)1, which are collected in the data map of 51 websites of the association.
The websites considered in this study are:
General: Argia, Berria, Hamaika TB, Sustatu and Zuzeu.
Thematic: Hey, Badok, Bertsolari, Dantzan, Elhuyar magazine, Gaztezulo, Hik Hasi, Irrien Lagunak, Jakin, Uztaro, Zientzia .eus and Zinea.eus.
Premises: Aiaraldea, Aikor, Aiurri, Alea, Anboto, Ataria, Baleike, Barren, Busturialdeko Hitza, Erran, Eta kitto! Euskal Irratia, Euskalerria Irratia, Goiena, Goierriko Hitza, Guaixe, Urola Irratia, Hiruka, Ipar Euskal Herriko Hitza, Irutxuloko Hitza, Karkara, Kanaldude
2. Upstream traffic
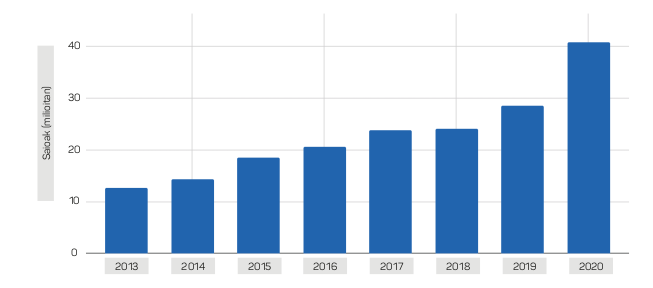
In 2020, the 3 barriers that have been collected on Hekimen websites have been overcome, with 40,805,565 content programs among all websites. 43% more than the previous year.
That"s a nice thing, because those 40 million views mean that media insertions in Basque have been 112 thousand times a day.
The evolution of these data over the last eight years is shown in the following table:
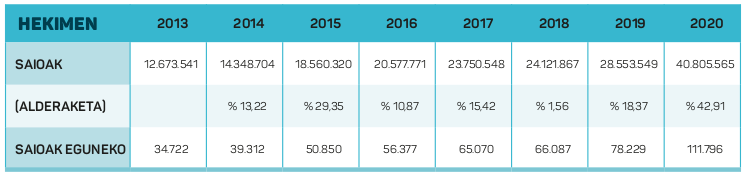
We couldn"t tell you how many different users or devices are doing all these sessions, because we"re collecting data between different media. But we could try a simple simulation. Each media outlet gets between 1.5 and 2 daily visits per user. This value varies a lot depending on the type of media, but we could say the average is there. Assuming that this would be maintained for the whole group, we could think that these 112,000 daily visits would be generated between 55-74,000 different devices.
That is, about 65,000 users visit, at least once a day, some of Hekimen"s websites. We think we can give the data up without fear of making a lot of mistakes.
The number of devices and users should be taken with caution, but if it is the same as the 112 thousand sessions a day, it is enough to show the significant weight of the web pages of the association.
We could also take a general picture of each 2020 session or visit.
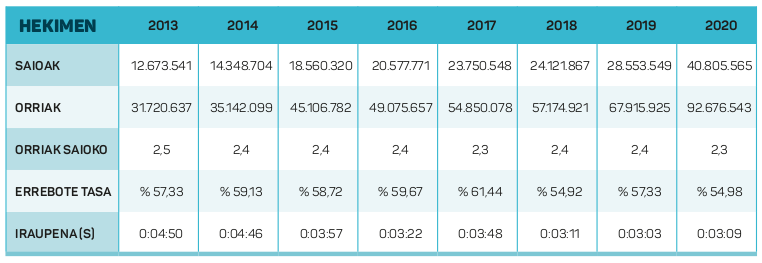
- During each visit, the user has seen an average of 2.3 pages, representing 92.6 million pages past.
- The duration of each visit was just over three minutes, three minutes and nine seconds.
- About 55% of the sessions have seen only one page, as it has entered and gone on the same page.
These data are shown in the following table showing the year-on-year evolution:
General data for the year therefore show that in 2020 there has been a significant leap in traffic in these media in Basque. This increase of 43% was the greatest increase recorded since the beginning of the PR data collection.
In our endeavour to further develop this increase and to explore the impact of the pandemic a little, we have spread the traffic evolution month by month. Here are the results in tables and graphs.
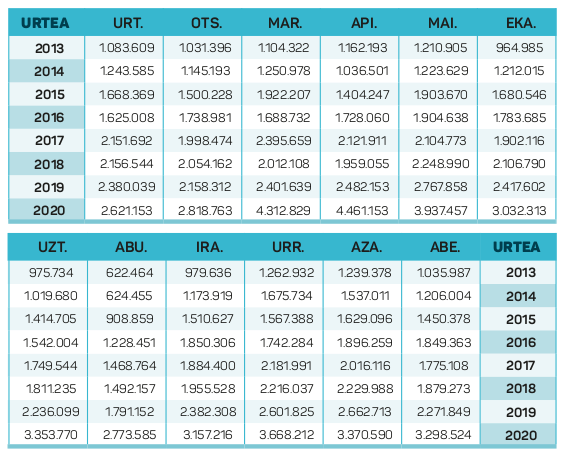
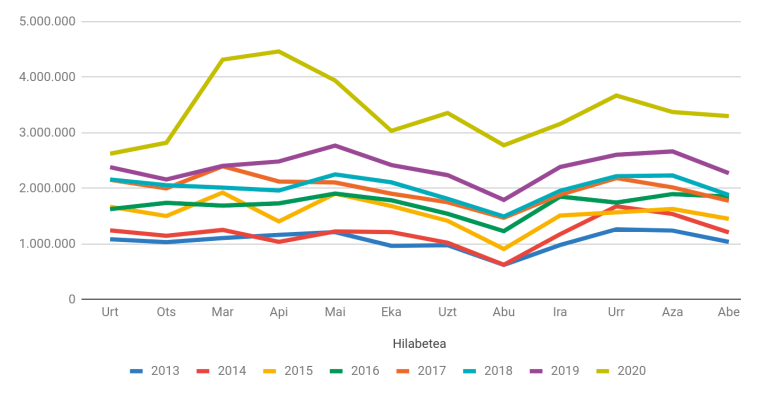
Declared by the World Health Organization (WHO) on 11 March 2020 as the COVID-19 pandemic, the graph shows a rise that occurs at this time. The increase comes from the previous month, as February traffic was also 31% higher than the previous year. In March, however, it almost doubled the previous year: The number of meetings increased by 80 per cent. From June onwards, an increase of around 40% was maintained in all months from here to the end of the year.
3. A small comparison
This 43% increase last year should be contextualised. Is that a lot? Not enough?
In the introduction, it was commented that last year there was a sharp increase in traffic in all digital media, despite the difficulty of searching for data. According to data provided by the US company Comscore5, digital media visits during the closure from January to March increased 63% in France, 58% in Spain, 58% in Germany, 68% in Italy and 54% in the UK. If we compare the months of January and March in the traffic of Himno websites, we could say that the increase was 65%. Without going into too much detail, it can be said that the rise in these countries was more or less maintained.
A more detailed comparison should be made, however, taking into account the data published by other media in our environment.
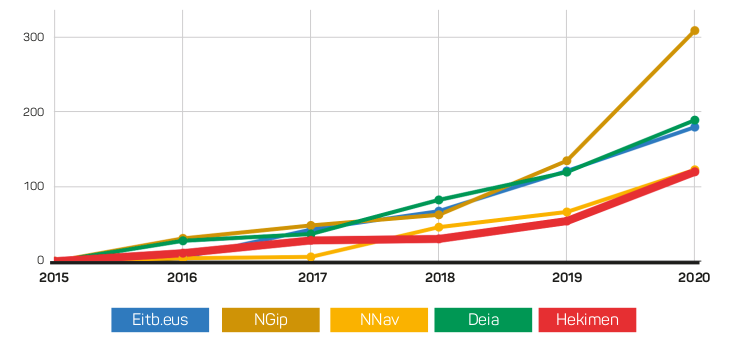
The following table lists the data published online by several media audited by OJD Interactive (Dissemination Justification Office). On the one hand, the media of Hego Euskal Herria: Add Eitb .eus, Deia, Noticias de Gipuzkoa and Noticias de Navarra, and several digital media from Catalonia that are expressed in Catalan: Ara, VilaWeb6 and ElŽ.
The following comparative table was elaborated with data from these media.
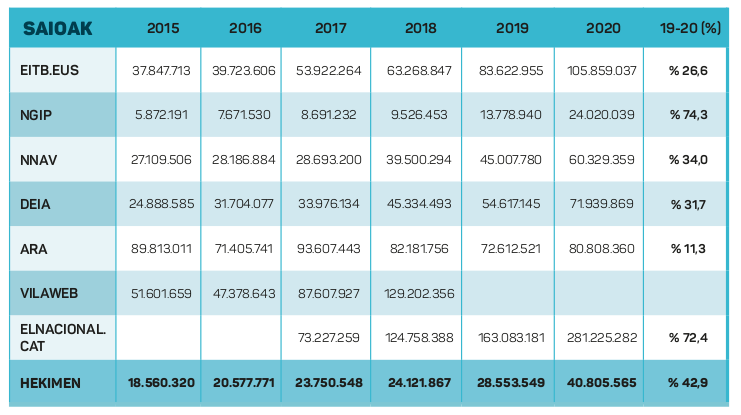
As noted in the table above, this 43% increase in Initiative H has been higher than in most other media. News from Gipuzkoa and ElBidasoa increased more (74% and 72% respectively) than the Initiative"s media.
In this hypothetical set of media, audited by the OJD and formed by Hekimen’s websites, the weight of Hekimen’s media has increased.
Among the media of Euskal Herria, the group audited by OJD (Eitb .eus, Noticias de Gipuzkoa, Noticias de Navarra, Deia y Hekimen) increased by 33% in 2020. Thus, Hekimen website traffic has risen above average. In addition, the increase in web traffic has been maintained, obtaining a fraction of cake slightly higher than that previously held for the websites of the association.
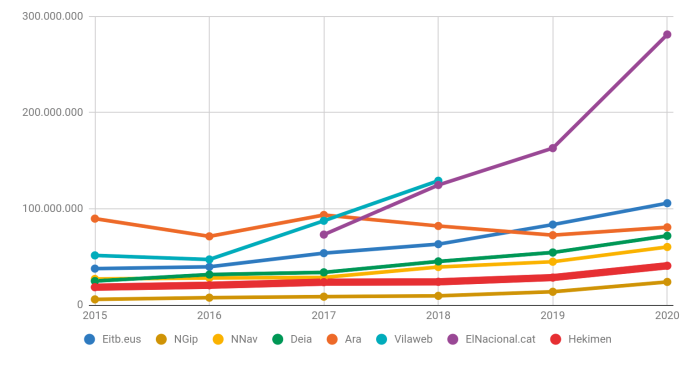
Rather than focusing solely on the data of the last year, it would be interesting to look slightly further and analyse the evolution of the last six years. How many have the media grown in recent years? What is its evolution?
In this case, Hekimen"s media reading is not that positive.
From 2015 data, the following table is obtained with the growth experienced by each medium in the last six years.
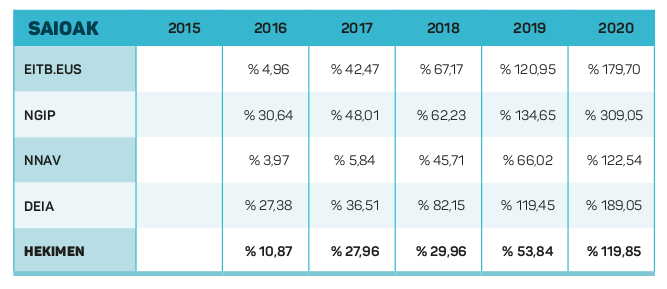
This media set in the Basque Country has grown by 173% between 2015 and 2020, while the Initiative’s web pages have grown by 120%, well below average. In six years Hekimen has made visits more than doubled, but the rest has grown more to nearly triple its sessions. Some have multiplied these sessions by four. Over the past six years, the media of the Initiative have lost relative weight among the media in the Basque Country, audited by the OJD.
Care should be taken with all these comparisons. It would be desirable to know and compare the data of many more media to determine to what extent consumption has actually changed in the Basque society network and to measure the evolution of Hekimen"s websites in this regard. However, most media do not provide their data openly and each is limited to reading. Also, within the Hekimen association, not all media are evolving in the same way in recent years.
Serve this small comparison to contextualize the general reading of the website sector in Basque and open the door to other deeper studies.
4. Types of media
Aggregate data from 51 media of the initiative have been mentioned so far, but it could be interesting to make a distribution by type of media. Remember that all the media of the Initiative are divided into three types: general, local and thematic.
Honatx disaggregated table.
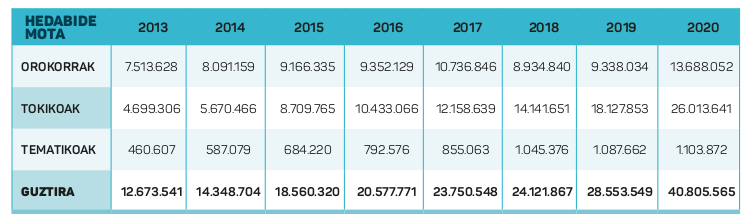
Looking a little more at the information in the table, the increase in the Initiative"s media has occurred in the general and local media, with an increase of 46.4% and 43.5% respectively. Contrary to the trend of previous years, the general media have increased above the average of Hekimen as a whole, while the local media are in pairs with the average of the whole. The themes grow by 51.0%.
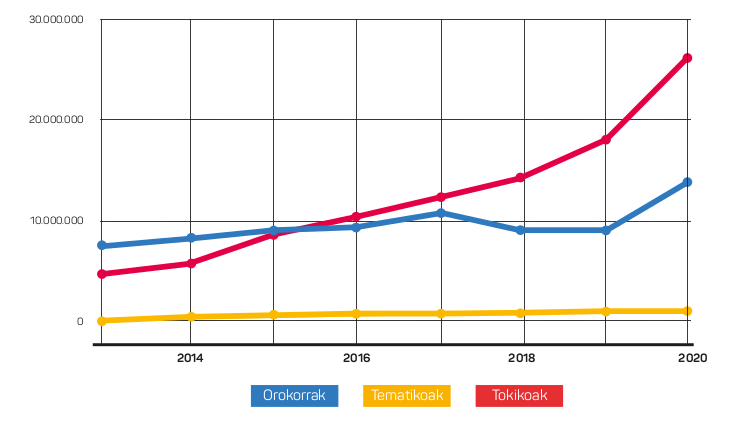
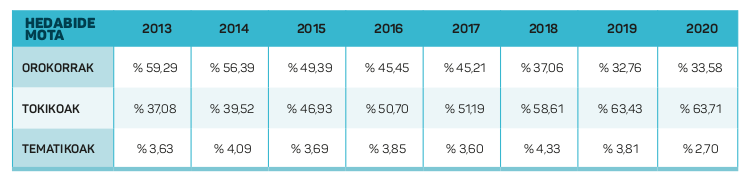
The weight of each type has therefore remained within this set of means. In 2019, the mass media reached 32.7% of total traffic, compared to 33.5% last year; the locals increased from 63.4% to 63.7%; the topics decreased from 3.8% to 2.7%.
All data and graph, below.
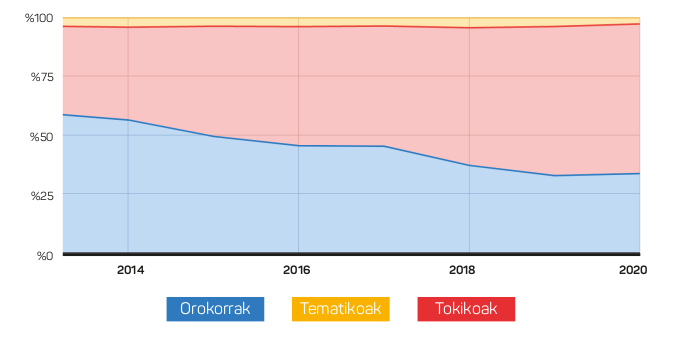
The thematic media, one by one, have experienced significant growth, probably due to their greater linkage with the issues of the pandemic. The rest of the topics, however, have not been able to maintain their upward trend. There have also been differences between the local and the general, because some have responded better than others to the information thirst of 2020. In general, however, they have maintained the trend of all other media.
The impact of the pandemic is reflected in a monthly analysis.
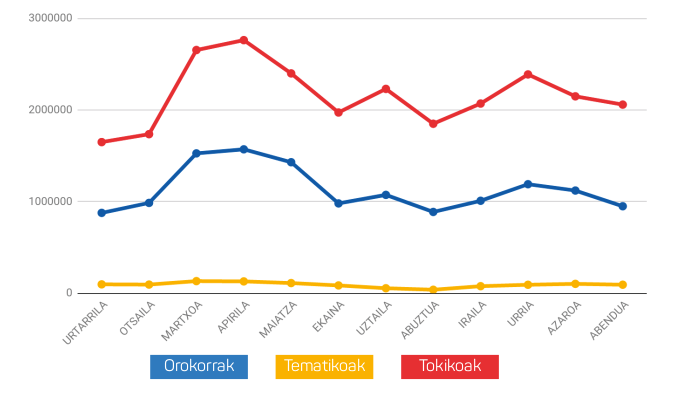
Not only throughout the year, but also month by month, the general and local media have had very similar behaviour. Both recorded a sharp rise from March to June and both have maintained a large part of the traffic gained. The themes also noted traffic growth in the hardest months of the pandemic, but not as much as other media.
5. To finish
Continuing the work done in recent years, this year we also collect data from Hekimen Analytics. The year 2020 has been special and this has partly conditioned the full reading.
Traffic has grown by 43%. This increase has mainly taken place from March, in two or three months in a very significant way. However, a significant proportion of users gained in the toughest weeks of the pandemic and in the closing periods have continued there thereafter, until the end of the year. If the year 2021 this year will also maintain this trend. It is not a bad wager because the challenge for all media is to turn new users gained into loyal users and not just in the era of the pandemic.
The increase in the last year has a great merit to be assessed. Traffic has increased in almost all media, but at this special time the media with the most resources and the large media also have the possibility and tendency to concentrate all information. Hekimen’s small media outlets, however, have kept the challenge and have managed to grow at least other media in the area. Local and Basque information has maintained its weight throughout the sector during this complicated year, making a great effort in this struggle to attract attention. It"s no small thing.
The success of this year must not, however, serve to forget the risks that may arise from a longer time horizon. Hekimen"s media has grown significantly over the past six years, but at least some of its surroundings have grown further. The growth ratio of the media in Basque is somewhat lower considering all these years than that of other media in the area. The difference is not great, but the pandemic shows us the differences that a small difference in growth ratio can generate in a few years. There"s the bet.
Obviously not all the media have achieved the same result. In terms of traffic, the local media continues to pull the entire media in Basque. In the last year, however, the media in general have also had a unique weight and importance, breaking their downward trend. The thematic media in Basque still do not gain weight.
We know, however, that media action cannot be measured only in visits. Not everything is a number of clicks, not everything is as long as counting devices. The influence of the media has many edges, some to measure the hardest ones than others and introduce them into the panels. In the absence of a more comprehensive look and analysis, this small piece of work serves to evaluate the work done and the results obtained by the Basque media network in a difficult year.
Sometimes it is convenient to go out to the balcony and applaud.
1.- Hekimen Analytics is a project of the Asociación de Medios de Comunicación Vasca Hekimen, created to collect some analytics from the websites of the association and work with two objectives: to analyze their evolution within the association and to use the tools to improve the comparison of the variables of the different websites. It was launched in 2015.
2.- In 2020, a couple of new local media has begun to be measured, so the data presented in this report have varied from those presented in the study last year. In addition, another small means of communication has modified the analytical system, which has also affected, especially in the last three years. Therefore, the data in the previous report are not fully repeated in the current analysis.
3.- We define as a visit or session the set of actions a user performs until entering and leaving a website. A particular user can perform several sessions throughout the day on a Web page; each session has a duration of X seconds and visits the Y page in each of them. In this work we will use the session or visit, both with the same sense.
4.- This article analyzes the concrete evolution of these weeks: Mimenza, Libe (2021): ‘We are illustrated by clicking (Euskera)’, <https://behbatib.eus/eu/euskaraz -klik-se hace click <https://behategia.eus/eu/euskaraz-klik-eginez-ilustratzen-gara/> <https://behbatib.eus/eu/euskaraz -klik-se click <https://behstrategy a.eus/eu/euskaraz-klik-egnes-ilustratzen-gara/> -illustrir-somos/>.
5.- Data in: What consumers in Europe do online during the lockdown, <https://www.comscore.com/Insights/Blog/What-consumers-in-Europe-do-online-during-the-lockdown> <https://www.comscore.com/Insights/Blog/What-consumers-in-Europe-do-onlin-during-the-lockdown> <https://www.comscore.com/Insights/Blog/What-trailers-in-Europe-do-online-ring-the-lockdown> <https://www.comscore.com/Insights/Blog/What-messenger-in-Europe-do-onlin-the-lockdown>.
6.- VilaWeb abandoned the OJD inspection so there is no data since 2019.