

In line with the analysis made for the previous Yearbooks, one more year we have analyzed the analytics of Hekimen websites. In 2019, 28.5 million sessions were broadcast on Hekimen’s websites, 18% more than the previous year. We"ve distributed them by media type and compared them to other websites. Furthermore, it has been the local media that have experienced the greatest growth, and attempts have been made to make their case a little more nuanced.
Introduction
Following the lines of the studies of the last two years, taking into account the data for 2019, in this article we will analyze the analytics of the websites of the Hekimen Association from the data provided by Hekimen Analytics (RP). We"ve formed a 7-year series with data from last year and we"re going to play with it.
In 2015, the RP was launched (although the data are since 2013) with the aim of jointly collecting metrics from Hekimen websites. Metrics are collected from 49 websites, collecting, among others, the data provided by Google Analytics. They are the basis for this study.
The websites considered in this study are:
General: Argia, Berria, Hamaika TB, Sustatu and Zuzeu.
Thematic: Hey, Badok, Bertsolari, Dantzan, Elhuyar magazine, Gaztezulo, Hik Hasi, Irrien Lagunak, Jakin, Uztaro, Zientzia .eus and Zinea.eus.
Premises: Aiaraldea, Aikor, Aiurri, Alea, Anboto, Ataria, Baleike, Barren, Busturialdeko Hitza, Erran, Eta kitto! Euskal Irratia, Euskalerria Irratia, Goiena, Goierriko Hitza, Guaixe, Uranuka, Ipar Euskal Herriko Hitza, Irutxuloko Hitza, Karkara, Lea Artibai Hitza, Maxixatzen, Noaua, Plaasso-hitza
As can be seen from the list, most websites are local (32, 65%); since last year’s analysis, Ipar Euskal Herriko Hitza has been added to the HA1 tool. Five (10% of the total) are generic national media and the remaining 12 (25%) are thematic or vertical thematic media.
Within the PR, data were collected from 2013. Some media have data from the start (31 media) and the rest has been added to the list in the coming years. Some because they were born later and others because they have set up the analytical system later.
Meetings
One of the parameters most used to measure a website"s audience is sessions, together with the number of users. In our case, since it is not possible to link and compare users of different media, this year we will focus on the sessions to discuss the weight of the media.
We define as a session or visit the set of actions a user performs until entering and leaving a website. A particular user can perform several sessions throughout the day on a Web page; each session will last X seconds and visit Y pages in each of them.
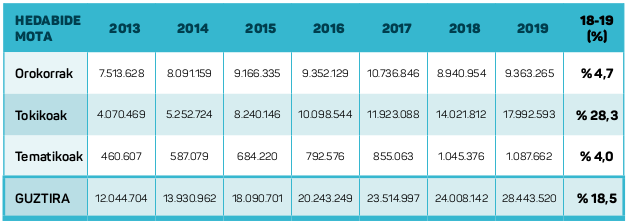
Below is a table with the sessions that have taken place in the last seven years, together with the interannual variation:
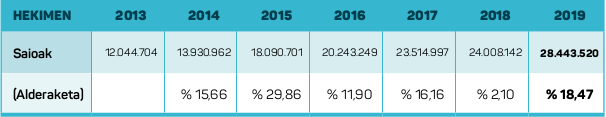
As can be seen in the table, in 2019, more than 28.4 million sessions have been held on the Hekimen websites. 18.5% more than the previous year. Despite the fact that in 2015 the number of sessions increased by 30%, a year in which new media were also created, the year of greatest growth was last year, with almost five million sessions won.
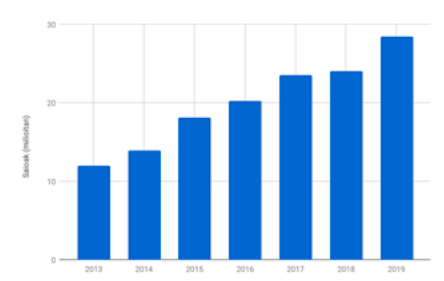
With a little more perspective, it is observed that the interannual trend in the total number of sessions is maintained. In five years, since 2014, the media network has gained over 10 million sessions, 57% of the total.
Comparison with other media
All increases should be put in context. Much or little, fast or slow, it"s always relative.
It will not be much to say that the use of the Internet is increasing. Because the number of devices and the time we spend in front of each device have also done so. We discussed this in the study last year, considering that the number of inhabitants connected to the CAPV network in the last three months increased by 20%. Conversely, the population that mentions the media as the reason for this connection did not increase more than 5%. Will this increase lead to media growth?
It is interesting to make comparisons with other media and here we renew this activity.
At the Office for Justification of Dissemination (OJD Interactive), the data published on the network by some of the media audited is included in a table. On the one hand, the media of Hego Euskal Herria: Add Eitb .eus, Deia, Noticias de Gipuzkoa and Noticias de Navarra, and several digital media from Catalonia that are expressed in Catalan: Ara, Vilaweb3 and ElŽ.
The following comparative table was elaborated with data from these media.
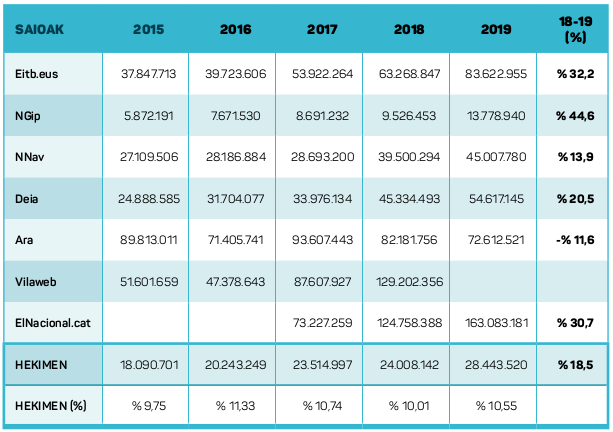
As can be seen from the table above, the 18.5% increase in Initiative H has generally been lower than in most media. They have increased more Eitb .eus, News from Gipuzkoa, Deia and Elúcat, and have increased or decreased less News from Navarra and Ara.
Taking these seven media together into account with the same Initiative, it can be estimated that the whole has grown by 18.7% in the last two years, so it can be said that Hekimen has grown as a whole, keeping the challenge of its evolution.
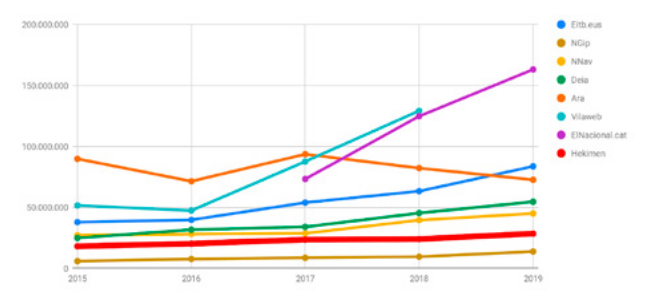
The graph also serves us to place us on the climb contacts. A hypothetical partnership with all these media would mean that the weight of the Initiatives in 2019 would be 10.5%, higher in 2016 and 2017. In 2018 it was somewhat smaller, but the decrease was mainly due to the decrease in the group"s largest media to date (A) in the last year. The graph shows the differences between media and media.
That is, it is good and valuable that Hekimen has achieved that 18.5% increase, but there are media that are working in another language in the area that are going up a bit more, as there are others that are going in the opposite direction. This data should be taken into account.
Types of media
We have mentioned the number of sessions generated by the whole initiative, but let us look at traffic according to the type of medium. Remember that all the media of the Initiative are divided into three types: general, local and thematic.
Evolution of the number of sessions by type of media:
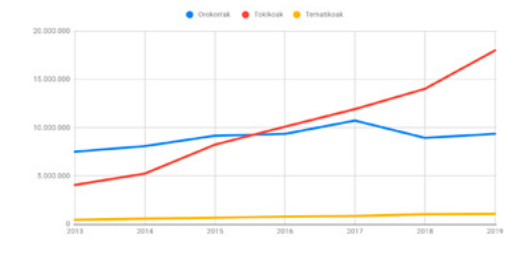
As can be seen in the table and in the graph, the trend of the previous year in 2019 remains, with the local media experiencing the greatest increase, with an increase of 28.3% in the last year. The media, both general and thematic, have also increased the number of sessions in the past year, but have experienced less growth in visits, with 4.7% and 4% respectively.
If you extend your gaze a little bit, you see this trend clearly. Local media have increased traffic by 242% in the last five years, between 2014 and 2019; thematic media have almost doubled traffic, with an increase of 85.3%; generals are the least increased 15.7% in the same period.
This has influenced the relative weight each type of medium has had in the sector. This can be seen in the following graph and table.
Evolution of the number of sessions by type of media:
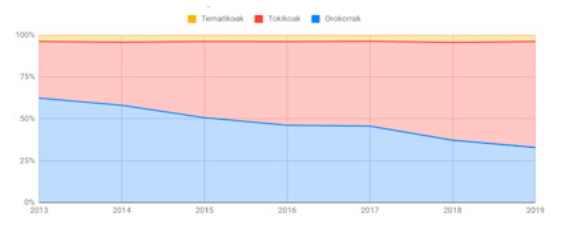
Annual relative weight of sessions by medium type.
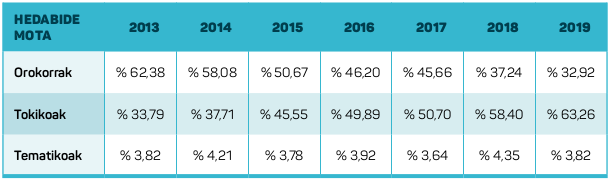
In 2013, local media received about 34% of all media visits; in 2019 it almost doubled, to around 63%. Consequently, the specific weight of the general and thematic media decreases. The general media receives about 33% of visits and about 4% of the thematic ones.
Some features of the sessions
Previous reports have also analyzed the characteristics of web traffic, especially the depth of sessions, the evolution of the devices used for the consumption of sources and media. Let"s take a quick look at the variables with this year"s data.
‘Depth’
Let"s start by looking at the nature of the sessions. What do sessions look like? How long does the user spend reading media news? And how many news does it receive per session?
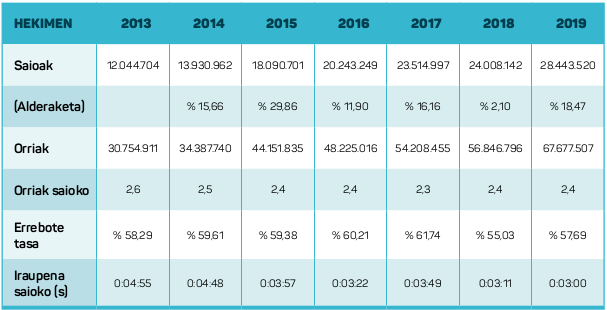
Every middle session has seen 2.4 pages per visitor in 2019. In 57.7% of the sessions you have seen only one sheet (which is the “bounce rate”) and in that session it took 3 minutes to see, hear and/or read its content. It is the set of features of the middle session.
The trend is continuing and more and more ‘light’ sessions are taking place if we look at time. On the contrary, the number of pages viewed per session is maintained, in number of past two. And the bounce rate barely makes a difference between 57 and 61 percent every year.
There are differences between different media and between different media types. Data broken down by type for the previous year are presented below.
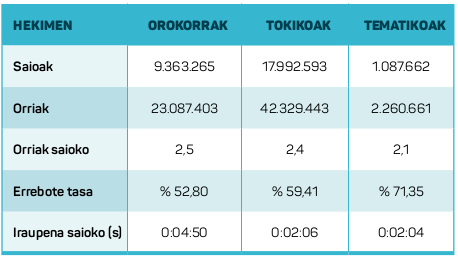
As in previous years, general media have the highest depth parameters. In each programme you see 2.5 pages in the media and its duration is almost five minutes, well above the average three minutes. Taking into account the second totals served, i.e. the product between sessions and seconds, the general media would have more weight in the sector than the other media. The rebound rate is also lower in these media. The topics have the highest bounce rate and the lowest number of pages per session, probably as it corresponds to its content and nature.
Traffic sources
A user can access the website of a media by different means, being important to identify these traffic sources, as well as to identify their strengths and weaknesses.
The RP tool divides media traffic sources into five categories:
Direct traffic: program in which the user has started a program by introducing the name of the media in his browser, accessing from the direct entrance to the mobile, clicking on the favorites… Created, say, by the “brand” of the medium.
Search engine traffic: Program started after searching for X words on Google (the largest and almost the only browser). The same name of the media is often sought, and this is also included in this group, although in reality it can also be understood as direct traffic.
Facebook traffic: Program that has started clicking on some link in the social network Facebook.
Twitter traffic: Login by clicking on a link in the Twitter social network.
Another traffic: any other source of traffic. According to the media, the weight will be higher or lower. Some, for example, the traffic they treat and obtain through e-posta newsletters; the one they receive through links from other websites; etc. All of them were included in the same group for this study.
The traffic sources of the sessions, both in absolute terms and in relative weight, for the last seven years are shown in the following table:
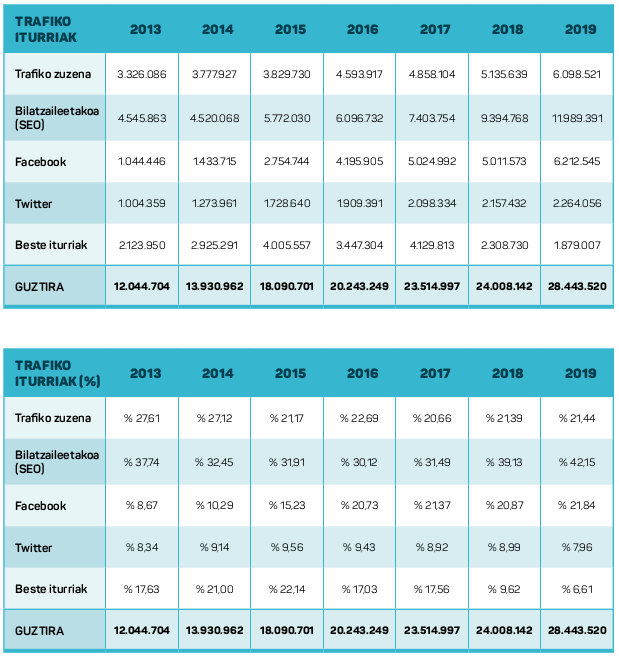
In absolute terms, all sources other than “other sources” have increased, as the total number of sessions has also increased. Reading percentages could be more interesting.
Percentage evolution of the source of the Initiative media sessions:
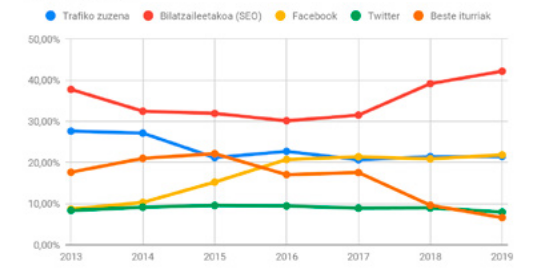
Search engine traffic remains the main source of traffic. It should be taken into account that, in many cases, this source of traffic should be treated as direct traffic, as people search engines for the "brand" of the media or write directly the URL or the address of a particular news item. For many, the browser itself is the entry point of the browser’s address and the trend has increased as mobile traffic increases. In addition, in Basque, search and SEO do not have much weight in general (this phrase might deserve another article).
Between direct traffic and search engine traffic, the Initiative media gets 63% of visits according to PR data. Facebook and Twitter have remained virtually stable over the last year. And search engines have taken the traffic that have lost "other sources" (newsletters, links to other websites, other social networks…).
If the analysis is done by media types, last year’s reading would be similar.
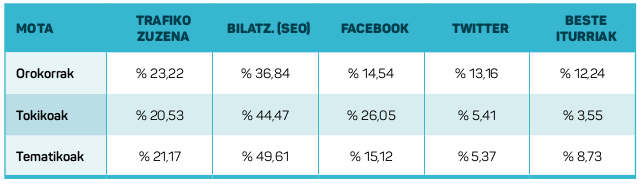
Percentage source of Hekimen media sessions by media type:
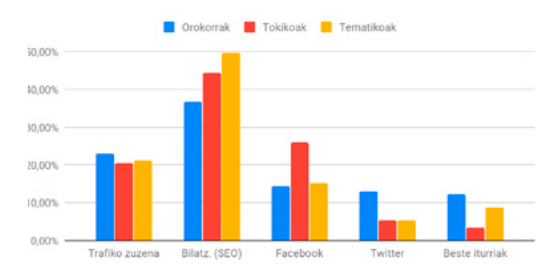
Traffic from search engines has more weight in thematic media, Facebook is especially strong in local media and Twitter is significantly stronger in general national media.
Devices
Finally, we will review the devices used by users for conducting the sessions under study. In the RP, these devices are divided into three groups: computer (both desktop and laptop), tablet and mobile.
The summary table for the last years, both in absolute terms and relative weight, is as follows:
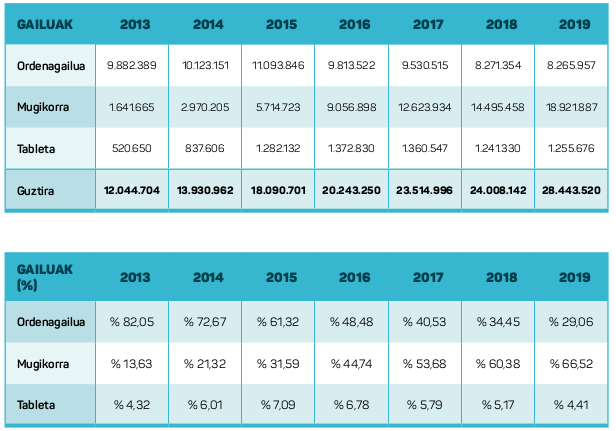
Number of media programmes under the Initiative:
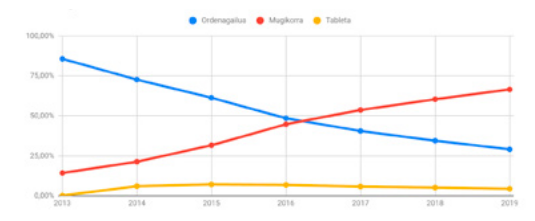
In 2019, again, most sessions have taken place from mobile, keeping the trend of recent years. 66% of sessions have been held from mobile. About 29% of the computer and the remaining 4% of the tablet. The expected results, certainly, as the replacement between devices in recent years is evident. It is also noteworthy the gradual weight loss of tablets, with a traffic that drops to about 5%. Because we have more and more mobiles available, according to some.
Although it is often said, it should be internalised that the media are mainly made for mobiles. From there you read, see or hear news, and that change has taken place in a few years. In 2013, mobile traffic represented 14% of traffic and today it is 66%. Two out of three sessions are held on mobiles and the rest on the tablet or, above all, on the computer.
Of course, there are big differences between the web and the web. These differences are also observed by type of study. Data for 2019:
Percentage arrangements for media sessions of the initiative, depending on the type of media.
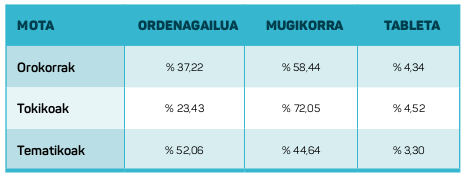
Percentage arrangements for media sessions of the initiative, depending on the type of media:
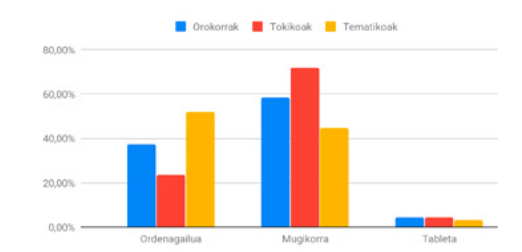
The mobile phone has a higher weight in the local media, 72%; in general this weight drops to 58% and in the thematic ones up to 45%. On topics, the weight of the computer remains the highest, 52%, although mobile phones also reach 45% (last year they did not reach 40%).
User loyalty
When starting the article, it has been commented that, in addition to the data from the most frequently used sessions in this study, the data of users is a conventional metric in network analytics. How many people access a particular media during a given time interval? And how many sessions and how do these users do? In fact, more than users, we should be talking about ‘devices’, which are measured in the analytics of how many mobiles, how many computers, how many tablets.
The RP tool collects data from users on a monthly basis, the number of ‘different and unique devices’ collected during that month. Of course, those of a month cannot meet with those of the next month, because some devices will repeat the visit. And in the same sense, users of one media and users of another cannot simply join together and say how many users the sector has.
However, it is important for users. How many faithful visitors does each media have? Do they have more loyal media than others?
Last year’s report commented that it is a very interesting ratio for the media the average number of sessions of each user in one month. I mean, how many visits has Urlia made to our media in a given month? How many Sandias?
With this ratio the medium takes a photograph of its faithful users. Suppose: For us the faithful user is the one who does “at least five sessions a month”. The limit, everyone can put at the point they want.
Not annual but this monthly ratio is recorded in the PR. And with this, we"re going to play a little bit now to sort of analyze the type and trend of each medium. As in the study last year, we will take as a reference the month of November each year.
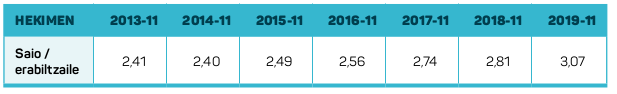
To launch Braust, we can say that in November last year there was an increase in user loyalty. Each user performed an average of 3.07 sessions. The upward trend of the previous year remains. This increase is 9.25%, so we could say that half of the annual increase corresponds to this improvement in fidelity.
We could also analyze it depending on the type of media, to see what the difference is. The summary table is as follows:
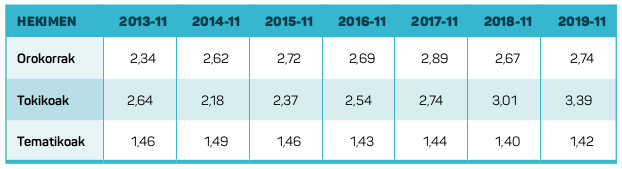
As expected, the most dispersed utilities or the least monthly sessions are the themes. Consultations on a particular subject appear to be more sporadic than consultations of the general information. The premises are the most loyal users, with an average of 3.4 sessions per user per month. In general, this ratio is around 2.7. And this table shows that the locals are the ones that have increased the most in this ratio in the last year.
Data from each medium are also interesting. It is not the objective of this study to enter into it, but to compare the growth of the media with the loyalty of users, it seemed interesting to show the following graph.
Hekimen media session/user ratio according to media growth:
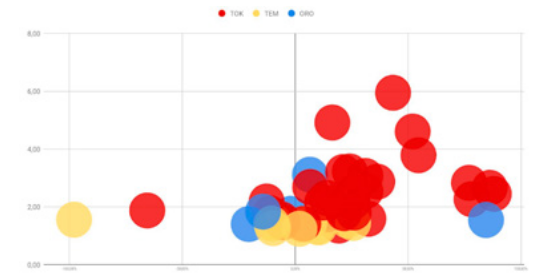
The following graph shows the 49 websites that collect the RP tools, differentiated by their color: general media, thematic reds and mostly blue, local media. We have deliberately concealed the names, which are not important for when it is meant.
Those on the right are the media that have grown the most in the last year, some locals and some general, while those on the left are the ones who have lost traffic in the last year. The higher up, the more sessions per user or, which is the same, the more faithful or repetitive.
There is a clear difference in the session/user ratio between the media. Some media get an average of six sessions per user, and others hardly pass through the barrier of 1.
Linking these ratios of growth and loyalty does not, of course, mean that both are necessarily united. Because a means of communication can grow through the capture of new users or their loyalty. What is observed in the graph is that it is possible to reach higher loyalty ratios, as there are some who have reached this point in the Hekimen network itself.
For any other conclusion, an individualized media analysis would be necessary and is not the objective of this small study.
Local media
In the previous points it is observed that in 2019 the trend of previous years continues and that the greater growth of Hekimen media has come from the hands of local media. As mentioned above, in 2013 they accounted for 33% of the sector, gaining weight in the sector with 63% of total traffic in 2019. In number, the most local media set.
So we"re going to focus a little bit on this set of media.
Obviously not all local media are equal either. There are media created around a newspaper, post-journal, with a powerful television, very linked to radio or digital natives. They are already created a few years ago or with a very long journey. There are projects at local, regional, urban and even national levels. The population occupied by the media is very variable. As well as the socio-linguistic situation in these areas. It is interesting to observe the differences between these characteristics.
Given that the local character is provided by the geographical scope, in this small study we will look at it. In order to focus a little more, we have divided the local media into three subcategories:
Public administrations: Baleike, Barren, Eta kitto! Karkara, Maxixatzen, Noaua, Otamotz, Plaentxia.eus, Txintxarri, Uztarria and Zarauzko Hitza.
Regional: Aiaraldea, Aikor, Aiurri, Anboto, Ataria, Busturialdeko Hitza, Urola erran, Goiena, Goierriko Hitza, Guaixe, Hiruka, Lea Artibai Hitza, Oarso-Bidasoa Hitza, Urumea Hitza and Kronika.
At capital or country level: Alea, Euskal Irratia, Euskalerria Irratia, Irutxuloko Hitza, Ipar Euskal Herriko Hitza and Uriola.
The user loyalty exercise carried out in the previous section is further detailed in this classification. The distribution of the ratio of spaces/users of the local media by their character of local media is presented below.
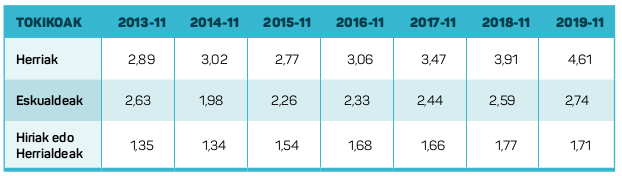
The most loyal users get the media linked to a single village. This loyalty ratio decreases as geographic areas occupy higher than population areas, at least in the measurements made in November 2019.
And the evolution of visits over the last two years, depending on the type of local media.
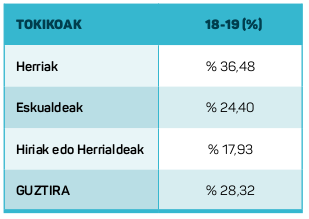
The growth of the last year, which has taken place in all local media, has not materialized in the same proportion in all local types either. The municipalities have grown the most, around 36.5%, and those in the region have also grown significantly, with 24.4%.
Demographic characteristics and linguistic competence may, inter alia, influence the popular, regional or national character of the geographical area covered by each media. Let"s look at the local media based on this data.
To begin with, we will see what kind of map the media make of the number of inhabitants of their area and the percentage of Euskaldunes in their area5.
Number of local media programmes of the initiative, according to the percentage of inhabitants and vascospeakers in the geographical area:
Of course, local local media are the lowest in terms of population, although there are only some with more population than all regions. The largest geographical areas are, as you would expect, urban and national. Media covering a larger geographical area should work, in general and with exceptions, in areas with less knowledge of the Basque country. In less Euskaldunes and in larger populations or counties there is a gap in the Basque pages of the Hekimen association.
Considering the fidelity of the users mentioned above, does this ratio affect the population of the geographical scope of the media and the percentage of Euskaldunes?
In the following two graphs we will see the influence of these variables by extending the eye in each one of them a parameter.
Session/user ratio of the local media of the Initiative, according to the number of inhabitants of the geographical area:
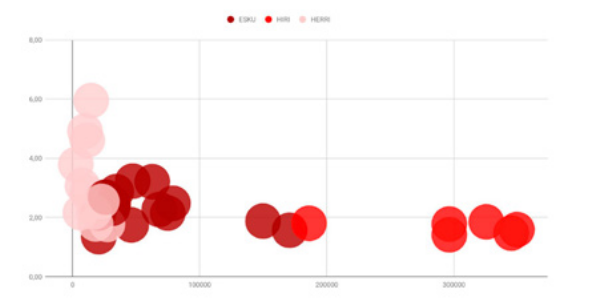
Media with a reduced geographical scope – which does not mean that these media are smaller – are the ones with the most loyal users, as can be seen in the graph. Most media outlets are below three, while some of those with the smallest geographic scope are above and some even above four or six. The isolated data mentioned in Table 13 can also be seen in the top graph.
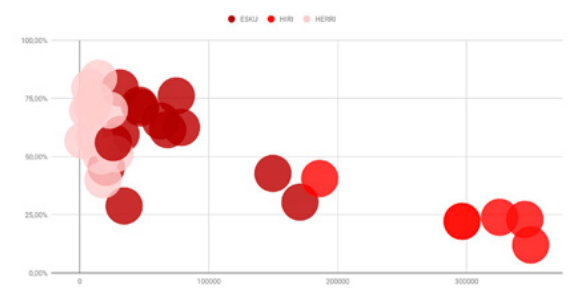
And does the percentage of Euskaldunes in these areas influence?
Session/user ratio of local media in Hekimen according to the percentage of Euskaldunes in this geographical area:
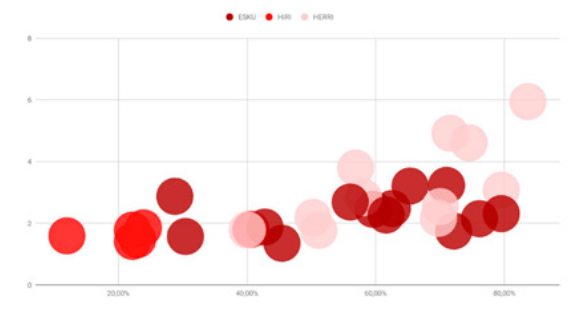
As shown in the graph above, the higher the concentration of Euskaldunes in the area, the higher the fidelity of the local media. The media in non-Basque areas have much more difficulty in obtaining repetitive users. It is not related to the absolute number of Euskaldunes, but to the weight these Euskaldunes have in that area. Visitor loyalty is enhanced by the existence of a “compact” community with a high percentage of owners.
Evidently, the two parameters mentioned are not the only variables that influence user loyalty. The quality of the information of each medium, its frequency, its nature, the accessibility of the Web… and other thousand factors, probably as important as those mentioned above. But to perform a deeper analysis, it would be necessary to have at least complete analytics of each medium and data related to content production. And that"s not the case. Moreover, it is not the object of this study. Let top reading be the starting point for a simple reflection on the nature of local media.
To conclude
In this article we collect data from Hekimen Analytics. The series of digital hearings over the past seven years has been completed with the latest data in the partnership database, which on the Internet we can say is a long series. It looks a little bit like a look and a little reflection with long air.
The situation in 2013 is radically different from that in 2019. Traffic has gone from 12 million to 28.5 million sessions, almost 80 thousand sessions a day. There is something.
Many are not necessarily sufficient. There are means that are growing faster and faster, that have much more resources, and that have gone beyond that 18% increase in our last year. Network traffic and media consumption are increasing and, despite the difficulties, it is important for the Hekimen media to maintain the Basque part of this cake. That"s the bet.
The characteristics of these sessions or visits have maintained the main tendencies that we had pointed out in previous years: two out of three (and four out of five in many media) come from mobiles, and most are programs related to the "brand" of the media, although traffic on social networks (Twitter and especially Facebook) remains important.
One of the points of this study has carried out a detailed analysis of a variable that assesses user loyalty in order to obtain loyal users who rehearse over and over again a correct way to continue growing the media. And since local media have grown to a greater extent in the analyzed media, we have tried to focus on these last points, where not everyone has followed the same trend. Some have grown a lot and others have not grown so much. What has caused this inequality? Can there be any key in the characteristics of the geographical space occupied by each or simply the activity of each media and the work done has caused this consumption? We haven"t looked for ways to give many answers, maybe more questions, and we"ve dared to make comparisons based on some variables.
Data, tables and graphs serve this simple analysis to illustrate and value the work of the 49 Basque websites of Hekimen. If someone finds a way forward, agree and thank you.
1.- The measurement of a new means of local communication began in 2019 (Ipar Euskal Herriko Hitza), so the data presented in this report have been modified from those presented in the study last year. In addition, another small local media has modified the analytical system, which has also affected. Therefore, the data in the previous report are not fully repeated in the current analysis.
2.- Population aged 15 and over using the Internet in the CAPV, last 3 months. Eustat: http://eu.eustat .eus/bancopx/euskara/id_2668/indiceRRR.html
3.- Vilaweb has ceded last year to the OJD inspection, so there is no 2019 data.
4.- Cárcava and Otamotz are municipalities of more than one locality, but they do not have regional rank and we have included them in the local category for this examination.
5.- Sources: 1) Language Competence of Peoples and Regions From the Euskera Database, Cluster of Sociolinguistics http://www.soziolinguistika .eus/edb/index.php2) Population of Peoples and Regions, from the Economic and Social Atlas of Euskal Herria http://www.atlasnet/demography