

Following the studies conducted for previous Yearbooks, one more year we have analyzed the analytics of the web pages of the Hekimen Association. By 2023 the barrier of 40 million visits was once again overcome, with an increase of 9% over the previous year and a new growing trend. These data have been distributed according to the type of media and contrasted with other websites to contextualize the evolution of the media in Basque.
Last year, in addition, the series of data brought from the Universal Analytics tool has been completed and Google Analytics has been launched 4. Furthermore, the implementation of the new version of this tool used by almost all the media has been an incentive for the Basque media to focus on digital analytics, collaborating from the Observatory in this way, either through the creation and configuration of BEBA panels.
1. Media listing, data sources and methodology
In this study we conducted an exercise to get to know the audience of 2023 of the websites of the Hekimen association, analyzing in detail the online behavior data collected by these websites in Basque last year.
As it has been done in previous years (Azpilhgh,2021, 2022; Azpilhgh& Lizarralde, 2017, 2019, 2020; Azpilhgh& Mimenza, 2023), the study has started from the data of the tool Hekimen Analytics1, but this year we have had to make two changes to the media and data sources listings.
On the one hand, data from 51 media outlets were used last year to complete the study and this year the database of 50 web pages has been completed, as a media media stopped collecting data last year2. The web pages considered in this study are:
Table 1: Media listing for the analysis 2023 of the websites of the Hekimen association.
|
GENERAL |
Argia, Berria, Hamaika, Sustatu eta Zuzeu |
|
LOCAL |
Aiaraldea, Aikor, Aiurri, Alea, Anboto, Ataria, Baleike, Barren, Busturialdeko Hitza, Erran, Eta kitto!, Euskal Irratiak, Euskalerria Irratia, Goiena, Goierriko Hitza, Guaixe, Hiruka, Ipar Euskal Herriko Hitza, Irutxuloko Hitza, Karkara, Kanaldude, Kronika, Lea-Artibaiko Hitza, Maxixatzen, Noaua, Oarso-Bidasoko Hitza, Otamotz, Plaentxia.eus, Txintxarri, Uriola, Urola-Kostako Hitza, Uztarria eta Zarauzko Hitza |
|
THEMATIC |
Aizu, Badok, Bertsolari, Dantzan, Elhuyar aldizkaria, Gaztezulo, Hik Hasi, |
Source: Hekimen Analytics.
On the other hand, only Hekimen Analytics has not been used as a data source, as the tool stopped collecting data in July 2023, so it has not been possible to bring data from all of last year from one source. Three sources have been used for data collection: Hekimen Analytics, BEHA 3 panel and Matomo.
The first two use Google Analytics to extract information, but two different versions of this web analytics tool, Universal Analytics (hereinafter UA) and Google Analytics 4 (GA4), respectively. In March 2022 (Google, 2022) the date of withdrawal of the UA version available since 2012 was announced, and from July 2023 this tool stopped collecting data (Google, 2023). At that time Hekimen Analytics stopped accumulating data. By then, the Basque media (Behstrategy 2023) and the data collected by Google Analytics 4 could be consulted through the BEHA panels. This data completes the 2023 data list of the media that use Google Analytics to find metrics for their website (98% of the cases in this study).
Matomo is also a third source of data. In fact, the list contains a means of communication that uses a service other than Google to get network traffic statistics, the free Matomo software installed on your server. We have brought the data for this case from there.
The data structure or analysis dataframe has been completed by providing information through these three routes. However, some gaps have been left in the table and the Holt-Winters method has been applied. This value prediction model makes predictions corresponding to a series of times, codifying the past values previously collected with an exponential smoothness algorithm to predict future values.
The metrics selected for the analysis have been collected monthly and the proportion of data sources used to compile the 2023 data table has been distributed as follows: 50.83% Google Analytics 4, 45.33% Universal Analytics 2% Matomo and 1.83% estimation.
Figure 1: Distribution of data sources from 2023 of the websites of the Hekimen association.
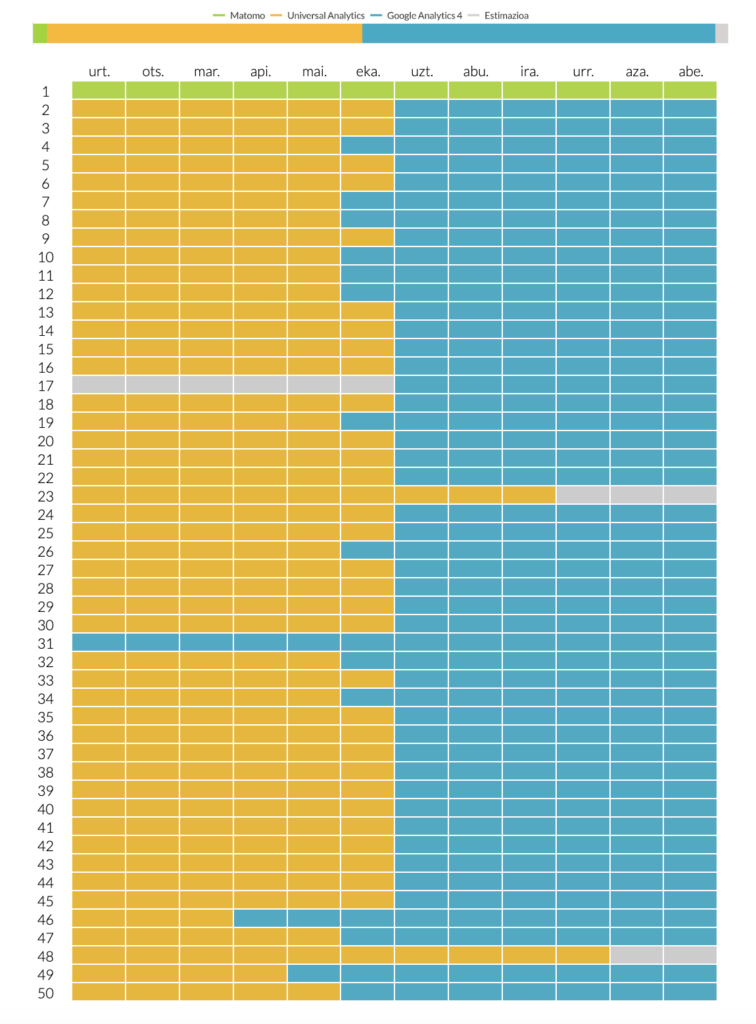
Source: own elaboration.
As data sources are different, there is a question that appears before the analysis: are the metrics collected from different sources comparable? The measurement protocols are similar in the tools Universal Analytics, Google Analytics 4 and Matomo that we have used to create the data table for the analysis of web pages in Basque. Although the ways of counting the indicators we are going to use during the analysis are not exactly the same, in some cases their combination is valid to complete the photo of Basque media web traffic last year and to follow the evolution of trends in recent years. In addition, this is the only way to complete the 2023 data table.
In the following sections, the results of the study will be presented in four sections: emphasis will be placed on the growth of web traffic, a comparison will be made with the metric volumes of other media, then focus on depth indicators and reflect on the different routes of access to the audience. In addition, a fifth paragraph is added to the article for exploring the effects of tool change (UA to GA4) that took place in web analytics in 2023.
2. Growth of web traffic
First, a general fact: in 2023 a barrier of 40 million digital media visits was overcome in Basque from the Hekimen association, with 40,306,766 sessions, 9% more than the previous year.
This is interesting and relevant, as these 40.3 million visits indicate that each day there was an average of 110 thousand media sessions in Basque, and that the pandemic approached the historical peak of the year (half a million visits).
The evolution of this data in the last eleven years in both tables and graphs is as follows:
Table 2: Annual sessions on Hekimen websites.
|
2013 |
2014 |
2015 |
2016 |
2017 |
2018 |
2019 |
2020 |
2021 |
2022 |
2023 |
|
| SESSIONS |
12.673.541 |
14.348.704 |
18.560.320 |
20.577.771 |
23.750.548 |
24.121.867 |
28.553.549 |
40.805.565 |
35.798.383 |
36.976.625 |
40.306.766 |
|
SESSIONS PER DAY |
34.722 |
39.312 |
50.850 |
56.377 |
65.070 |
66.087 |
78.229 |
111.796 |
98.078 |
101.306 |
110.429 |
|
COMPARISON |
— |
+ % 13,22 |
+ % 29,35 |
+ % 10,87 |
+ % 15,42 |
+ % 1,56 |
+ % 18,37 |
+ % 42,91 |
- % 12,27 |
+ % 3,29 |
+ % 9 |
Source: Google Analytics 4, Universal Analytics, Matomo and estimate4.
Figure 2: Annual sessions on Hekimen websites.
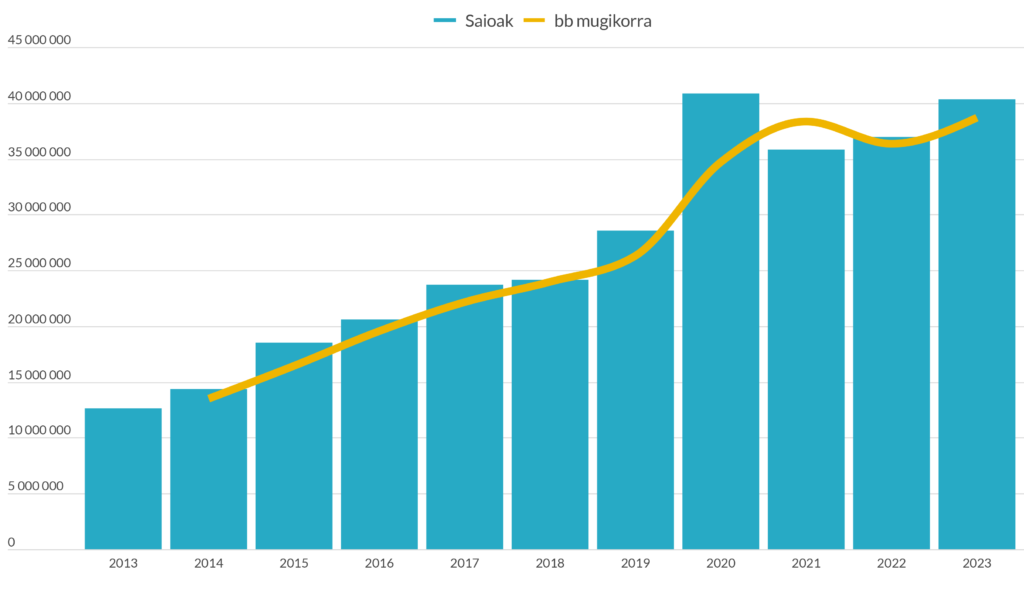 Source: Google Analytics 4, Universal Analytics, Matomo and estimate.
Compared to last year, 3.3 million visits were received in 2023 more than the previous year, which represents a 9% increase in Hekimen’s web traffic.
Next we will also focus on the last five-year period, in which the first year of this series was 2019, the last one before the pandemic, and since then the sector analyzed has increased by 41%. The coronavirus shot full volume metrics in 2020, and this maxim opened up a margin of uncertainty about how to interpret what we have not been very clear in the last three years, but, by completing the series with last year’s data, it seems that the period 2020-2022 was an exception and, leaving behind this anomaly, the media in Basque are in an upward trend that came back earlier (which can be seen in the moving average). The following year shall confirm or reject this impression.
So far we have mentioned the aggregated data of all the media of the Hekimen association, as if they were a single website in Euskera, but not so, and there are great differences between them. It is therefore interesting to look at the main groups. The 50 digital portals of the Hekimen association of this study are divided into three types (see Table 1): 10% are general, 66% local and 24% thematic.
The following is a table disaggregated of the number of sessions by type of media and their graphic evolution:
Table 3: Sessions of the websites of the Hekimen association by type of media.
|
2013 |
2014 |
2015 |
2016 |
2017 |
2018 |
2019 |
2020 |
2021 |
2022 |
2023 |
|
|
GENERAL |
7.513.628 |
8.091.159 |
9.166.335 |
9.352.129 |
10.736.846 |
8.934.840 |
9.338.034 |
13.688.052 |
10.864.134 |
12.666.494 |
12.781.789 |
|
LOCAL |
4.699.306 |
5.670.466 |
8.709.765 |
10.433.066 |
12.158.639 |
14.141.651 |
18.127.853 |
26.013.641 |
23.842.828 |
23.218.076 |
26.490.640 |
|
THEMATIC |
460.607 |
587.079 |
684.220 |
792.576 |
855.063 |
1.045.376 |
1.087.662 |
1.103.872 |
1.091.421 |
1.092.055 |
1.034.337 |
|
HEKIMEN |
12.673.541 |
14.348.704 |
18.560.320 |
20.577.771 |
23.750.548 |
24.121.867 |
28.553.549 |
40.805.565 |
35.798.383 |
36.976.625 |
40.306.766 |
Source: Google Analytics 4, Universal Analytics, Matomo and estimate.
Figure 3: Sessions of the websites of the Hekimen association by type of medium.
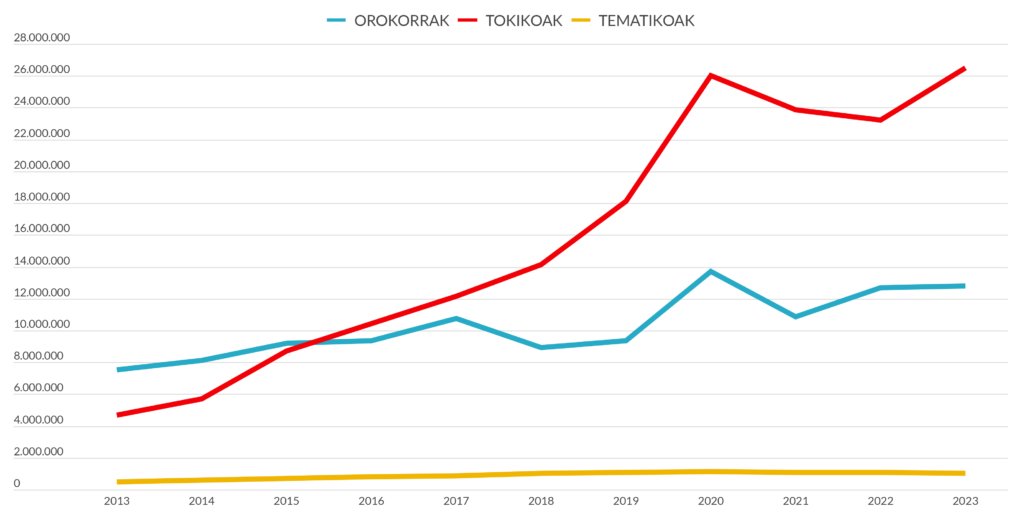 Source: Google Analytics 4, Universal Analytics, Matomo and estimate.
With 3.2 million visits, the local media increased the most in 2023, with a growth of 14% compared to the previous year and a historic peak in 2020. The media in general, despite the lower concentration of the growth rate, also evolved increasingly — 115 thousand more visits (1% more). On the contrary, the thematic media group lost almost 58,000 sessions and fell 5%.
The year 2023 was the year of the municipal and foral elections in Hego Euskal Herria, in which part of the explanation of the increases in the audience of the local media can be found. Araba, Bizkaia, Gipuzkoa and Navarra are the main websites of all the local media analyzed (91%) and are a reference for monitoring the local election results.
Figure 4: Monthly local media sessions 2023.
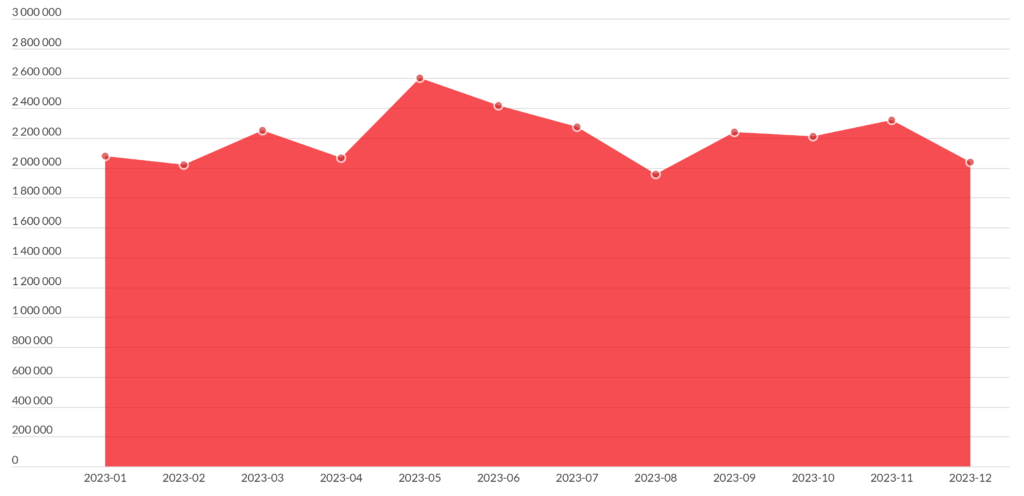
Source: Google Analytics 4, Universal Analytics and estimate.
As can be seen from the graph, May was the month of 2023 with more visits (10% of the sessions) — on 28 May the municipal and foreign elections were held — and June the second (9%) — still the day after the votes. In these two months, almost one in five visits of the whole year were counted.
On the other hand, the previous exercise is resumed by analyzing the traffic evolution in the last five-year period according to the type of media: the locals and the generals increased by 46% in the period 2019-2023, while the thematic group decreased by 5%.
The set of each type of media has a different number of websites and the dimensions of the number of sessions are different. Therefore, the following figure shows the evolution of each of the complexes at their scale and, taking into account the mobile average, their variations are clearer:
Figure 5: Moving averages of the annual sessions of the websites of the Hekimen association, according to the type of medium and scale.
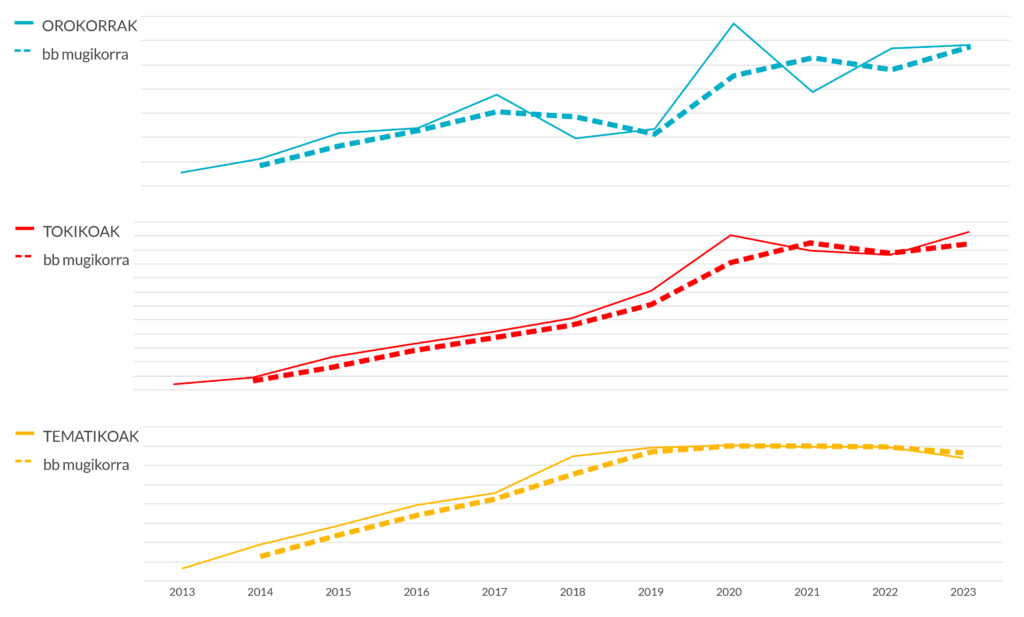
Source: Google Analytics 4, Universal Analytics, Matomo and estimate.
The graphic evolution of web traffic could be divided into two parts, on the one hand, in the period from 2013 to 2019 and on the other, in the last five-year period. In this second period, the clearest trends are observed according to media types: while the web traffic of the general and local media grows, visits to thematic portals stagnate and show a decreasing trend.
The set of sites is the one that brings together the largest number of websites, specifically 33 media included in the list of this study, with the locals having the greatest weight in web traffic. However, the relationship between the number of media and weight is not always fulfilled, as with few media it can be significant, as the generals manage by measuring five portals. The volume of traffic is the determining indicator for the distribution of the relative weight.
The interannual evolution of these weights by type of media is shown in the table and graph below.
Table 4: Relative weight of the websites of the Hekimen association by type of medium.
|
2013 |
2014 |
2015 |
2016 |
2017 |
2018 |
2019 |
2020 |
2021 |
2022 |
2023 |
|
|
GENERAL |
% 59,3 |
% 56,4 |
% 49,4 |
% 45,4 |
% 45,2 |
% 37 |
% 32,7 |
% 33,5 |
% 30,3 |
% 34,3 |
% 31,7 |
|
LOCAL |
% 37,1 |
% 39,5 |
% 46,9 |
% 50,7 |
% 51,2 |
% 58,6 |
% 63,5 |
% 63,8 |
% 66,6 |
% 62,8 |
% 65,7 |
|
THEMATIC |
% 3,6 |
% 4,1 |
% 3,7 |
% 3,9 |
% 3,6 |
% 4,3 |
% 3,8 |
% 2,7 |
% 3 |
% 3 |
% 2,6 |
Source: Google Analytics 4, Universal Analytics, Matomo and estimate.
Figure 6: Relative weight of the websites of the Hekimen association by type of medium.
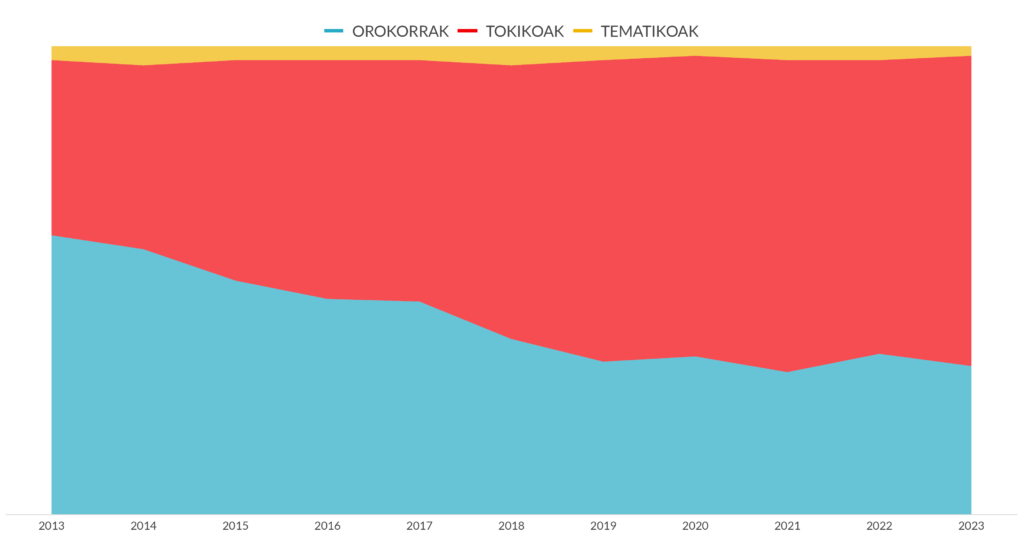
Source: Google Analytics 4, Universal Analytics, Matomo and estimate.
As shown in the table above, of the 40.3 million sessions achieved in 2023 by the websites of the Hekimen association, 65.7% of the local media websites were 26.5%. The mass media gathered about 12.8 million visits, 31.7% of total traffic. The topics continue with about one million attempts over the last six years and accumulated 2.6% of last year’s total.
3. Growth of web traffic in other media
As in the work of previous years, this year we will also make a comparison of the number of visits with other media in the area, as it can help to say whether the traffic data have been good or bad. To do this, we will take into account the data published on the network by some of the media audited by OJD Interactive (Dissemination Justification Office), comparing the data it provides with those collected by us for the 2023 analysis5.
Careful consideration should be given to all comparisons of the following lines. What would be desirable for a more complete result would be to know and contrast the data of many more media, but most media do not offer their data openly and simply do their own reading. Grain before saying anything else.
Let us expand the first look to other media of Hego Euskal Herria: Álava News, Gipuzkoa News, Navarra News, Deia and eitb.eus6.
Table 5: Comparison of sessions on thousands of websites of Hekimen and OJD in Hego Euskal Herria.
|
2013 |
2014 |
2015 |
2016 |
2017 |
2018 |
2019 |
2020 |
2021 |
2022 |
2023 |
|
|
NAla |
— |
— |
— |
— |
4.481 |
4.471 |
5.436 |
8.788 |
18.787 |
31.972 |
35.008 |
|
NGip |
3.872 |
4.963 |
5.872 |
7.671 |
8.691 |
9.526 |
13.778 |
24.020 |
31.945 |
39.782 |
45.802 |
|
NNav |
21.927 |
22.967 |
27.109 |
28.186 |
28.693 |
39.500 |
45.007 |
60.329 |
86.272 |
99.422 |
106.458 |
|
Deia |
23.418 |
22.729 |
24.888 |
31.704 |
33.976 |
45.334 |
54.617 |
71.939 |
80.138 |
81.681 |
82.213 |
|
eitb.eus |
28.001 |
34.319 |
37.847 |
39.723 |
53.922 |
63.268 |
83.622 |
105.859 |
72.555 |
52.419 |
58.923 |
|
HEKIMEN |
12.673 |
14.348 |
18.560 |
20.577 |
23.750 |
24.121 |
28.553 |
40.805 |
35.798 |
36.976 |
40.306 |
|
TOTAL |
89.891 |
99.326 |
114.276 |
127.861 |
153.513 |
186.220 |
231.013 |
311.740 |
325.495 |
342.252 |
368.712 |
|
HEKIMEN (%) |
% 14,10 |
% 14,45 |
% 16,24 |
% 16,09 |
% 15,47 |
% 12,95 |
% 12,36 |
% 13,09 |
% 11,00 |
% 10,80 |
% 10,93 |
Source: Google Analytics 4, Universal Analytics, Matomo and estimazioa + OJD Interactiva.
Figure 7: Comparison of sessions on thousands of websites of Hekimen and OJD in Hego Euskal Herria.
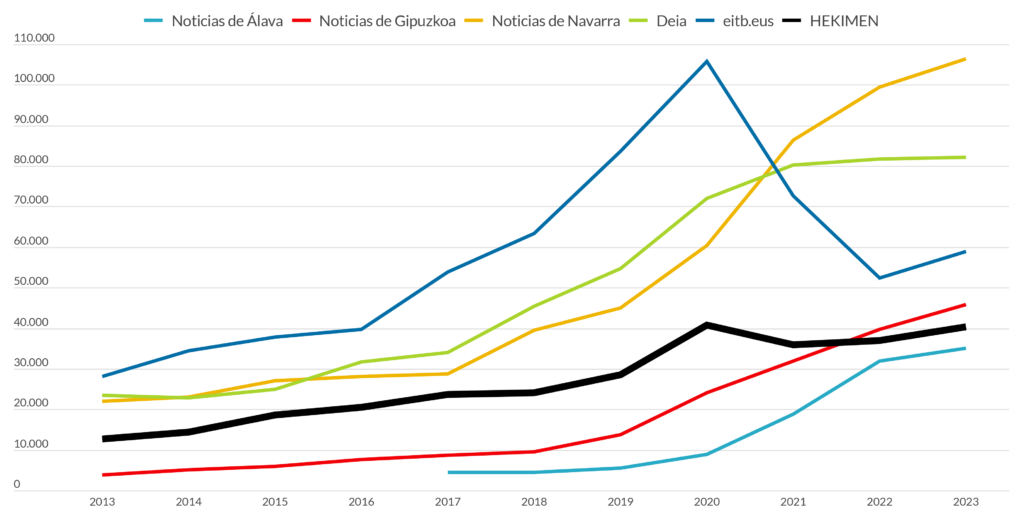
Source: Google Analytics 4, Universal Analytics, Matomo and estimate + OJD Interactiva.
As shown in the table and in the graph, it was not the Hekimen association that grew in 2023. All had a growing trend and most grew in greater proportion, but without significant differences: 15.1% News from Gipuzkoa, 12.4% eitb.eus and 9.5% News from Álava. The remaining two showed a lower increase than the Hekimen media reported in this study (News from Navarra grew by 7.1% and Deia by 0.7%).
Within the group audited in Hego Euskal Herria, the weight of the Initiatives has remained similar in the last five-year period, although the annual value is decreasing in an oscillation of 2.2 points.
We could do the same exercise with other media. Below we will talk about several digital media from Catalonia that speak Catalan 7: ara.cat, diaridegirona.cat, elnacional.cat and rac1.cat7.
Table 6: Comparison of sessions on thousands of Hekimen and OJD websites in Catalonia.
|
2017 |
2018 |
2019 |
2020 |
2021 |
2022 |
2023 |
|
|
ara.cat |
93.607 |
82.182 |
72.613 |
80.808 |
62.429 |
59.424 |
64.907 |
|
diaridegirona.cat |
20.071 |
19.984 |
29.807 |
41.222 |
40.549 |
49.951 |
42.771 |
|
elnacional.cat |
73.227 |
124.758 |
163.083 |
175.678 |
194.883 |
208.797 |
180.184 |
|
rac1.cat |
53.197 |
36.053 |
42.031 |
59.155 |
58.781 |
53.436 |
58.839 |
|
HEKIMEN |
23.751 |
24.122 |
28.554 |
40.806 |
35.798 |
36.976 |
40.306 |
|
TOTAL |
263.853 |
287.098 |
336.088 |
397.670 |
392.440 |
408.584 |
387.010 |
|
HEKIMEN (%) |
% 9,00 |
% 8,40 |
% 8,50 |
% 10,26 |
% 9,12 |
% 9,05 |
% 10,41 |
Source: Google Analytics 4, Universal Analytics, Matomo and estimate + OJD Interactiva.
Figure 8: Comparison of sessions on thousands of Hekimen and OJD websites in Catalonia.
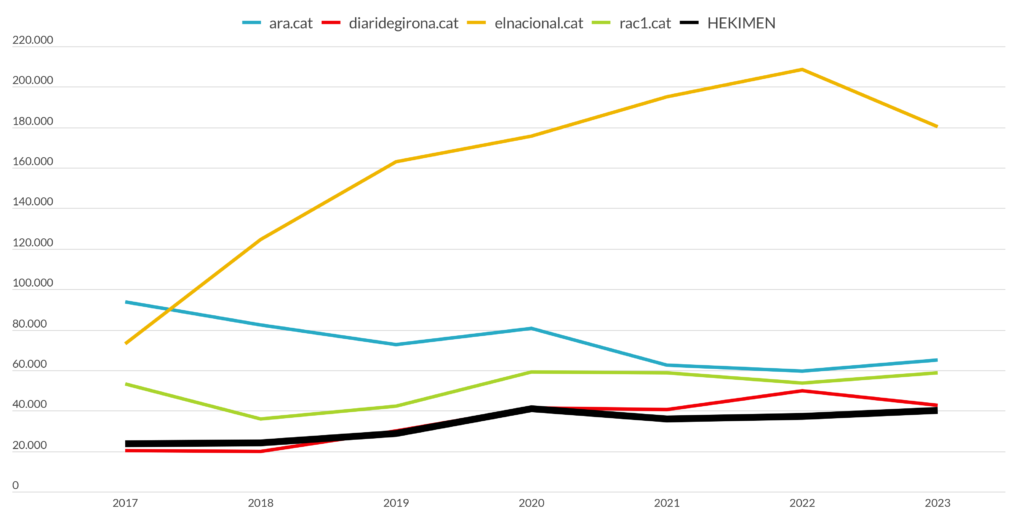
Source: Google Analytics 4, Universal Analytics, Matomo and estimate + OJD Interactiva.
Regarding the media in Catalonia, in the last year their number of sessions diaridegirona.cat and elnacional.cat have decreased, by 14.4% and 13.7% respectively, while websites rac1.cat and ara.cat have increased in a similar proportion to the Initiatives (10.1% and 9.2% in these cases).
Overall, the weight of H initiatives has remained similar in the last seven years audited, although this time the annual value is increasing, within a two-point oscillation.
4. Audience depth
Not everything is session or visit, of course, although in this work we have focused on that metric when talking about traffic. For example, the number of users must be taken into account when measuring the audience of a media and the time each user passes on the media web. These are important parameters when analyzing the influence of a media.
Given that the data collected in this study to know the audiences of the websites of the Hekimen association come from different sources of information and the individual follow-up has been configured in their collection, today we cannot compare users between different media, not only add the amounts from one month to another or from a website —because some devices will repeat the visit every month, or because the users of a media will be the same.
In any case, without this data, we could analyze other characteristics of web traffic in search of clues to better understand the audience. Two indicators related to the depth of visits, such as the pages per session and the average time of the sessions.
Table 7: Annual evolution of the "Pages per session" metric on the web pages of the Hekimen association.
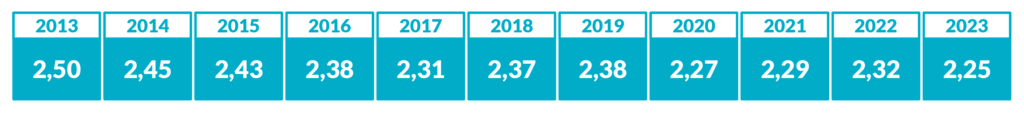
Source: Google Analytics 4, Universal Analytics, Matomo and estimate.
The average number of pages viewed per user per visit is 2.25, both general and local and thematic 1.99, and this depth of sessions indicator has remained very stable during all the measured years.
Thus, in 2023 90 million pages (specifically 90.766.705) were read on Hekimen’s websites, 4.9 million more than the previous year.
There is another metric that provides information about the depth of the sessions and is the time the visits last, that is, the duration of the attention to the attracted users. Among the measurements that have been modified from the UA version to the GA4 is the way in which the duration of the sessions is recorded, so we have not been able to bring to this analysis the annual evolution of the indicator, but the data from 2023.
Table 8: Distribution of the "average session time" metric in 2023 by type of media.
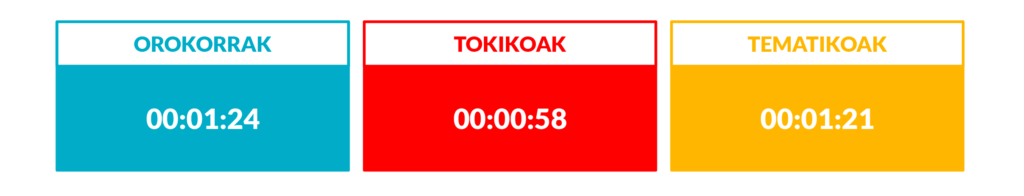
Source: Google Analytics 4, Matomo and estimate.
Visits to Hekimena's websites lasted an average of one minute and six seconds in 2023, 18 seconds longer in the general media and 15 seconds longer in the thematic media, while visits from the premises did not reach the minute.
5. Audience device and traffic sources
Another factor that influences the quality of sessions is the origin of visits, that is, the origin of traffic.
The proportional evolution of the number of sessions of the websites of the Hekimen association by type of device is as follows:
Table 9: Distribution of annual sessions by device from the websites of the Hekimen association.
|
2013 |
2014 |
2015 |
2016 |
2017 |
2018 |
2019 |
2020 |
2021 |
2022 |
2023 |
|
|
PC |
% 82,27 |
% 73,07 |
% 61,78 |
% 48,76 |
% 40,70 |
% 34,54 |
% 29,11 |
% 24,21 |
% 24,88 |
% 21,93 |
% 34,99 |
|
MOBILE |
% 13,51 |
% 20,96 |
% 31,17 |
% 44,43 |
% 53,49 |
% 60,28 |
% 66,46 |
% 72,48 |
% 72,35 |
% 75,61 |
% 63,32 |
|
TABLET & OTHER |
% 4,23 |
% 5,97 |
% 7,05 |
% 6,81 |
% 5,80 |
% 5,18 |
% 4,43 |
% 3,30 |
% 2,77 |
% 2,45 |
% 1,93 |
Source: Google Analytics 4, Universal Analytics, Matomo and estimate.
As shown in the table, mobile navigation since 2017 is the main means of communication in Basque.
If we look at the 2023 data, the distribution is as follows: 63% of visits started with mobiles, 35% computers and 2% tablets or others. If a monthly analysis is carried out, it is concluded that in summer phone traffic increases slightly (seven out of ten visits started on mobile last August). The analysis by type of medium allows the detection of differences:
Figure 9: Distribution of 2023 sessions of the websites of the Hekimen association by devices and type of media.
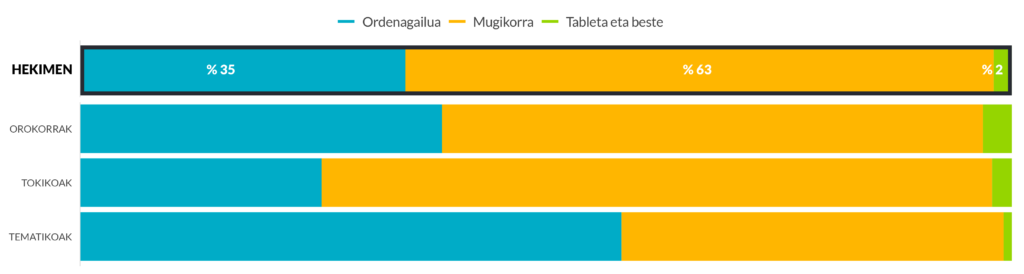
Source: Google Analytics 4, Universal Analytics, Matomo and estimate.
The general media group is the most similar to the distribution by devices of the Hekimen association, although the percentage of their tablets and other devices is higher (3.1%). In the premises the highest weight of the mobile phone stands out (72.2%) and in the thematic the computer is the main origin of the sessions (58.1%).
The following is an analysis of the interannual proportional evolution of visits by traffic source:
Table 10: Distribution of annual sessions of the websites of the Hekimen association by traffic sources.
|
2013 |
2014 |
2015 |
2016 |
2017 |
2018 |
2019 |
2020 |
2021 |
2022 |
2023 |
|
|
DIRECT |
% 27,08 |
% 26,99 |
% 21,26 |
% 22,69 |
% 20,67 |
% 21,42 |
% 21,45 |
% 22,07 |
% 23,75 |
% 22,12 |
% 30,29 |
|
ORGANIC |
% 36,63 |
% 31,97 |
% 31,50 |
% 29,92 |
% 31,46 |
% 39,14 |
% 42,15 |
% 41,26 |
% 46,27 |
% 48,94 |
% 45,01 |
|
SOCIAL |
% 16,65 |
% 19,10 |
% 24,30 |
% 29,90 |
% 30,14 |
% 29,80 |
% 29,76 |
% 23,49 |
% 19,22 |
% 15,59 |
% 19,02 |
|
OTHERS |
% 19,64 |
% 21,94 |
% 22,94 |
% 17,49 |
% 17,73 |
% 9,64 |
% 6,64 |
% 13,18 |
% 10,75 |
% 13,35 |
% 5,68 |
Source: Google Analytics 4, Universal Analytics, Matomo and estimate.
One of the search engines is the main source of traffic measured on Basque media portals, and this has been the case in the last eleven years. Behind this known as organic traffic, two types of visits can be classified: on the one hand, the set of sessions that occur when writing the URL or the address of a specific news item or, in most cases, clicking and, on the other, the search for brands to be treated as direct traffic, as many users insert the name of the media into the search engines.
75.3% of the sessions obtained on the websites of the Hekimen association in 2023 started from direct traffic and search engines. According to the collected data series, search engine traffic has decreased by four points in the last year and direct traffic has increased by eight points (37% more). The dissemination of the channels of messaging applications or the provision of postal newsletters can be the nexus of the growth of this direct traffic8, as both are the channels that the media have recently prioritized in the network to establish a direct relationship with its audiences. In contrast, the remaining 19% of the sessions reached the Basque media by clicking on some social media link last year, and 5.7% of other websites and/or references.
High, this distribution of traffic sources varies according to the type of medium:
Figure 10: Distribution of 2023 sessions of Hekimen websites by traffic sources and media type.
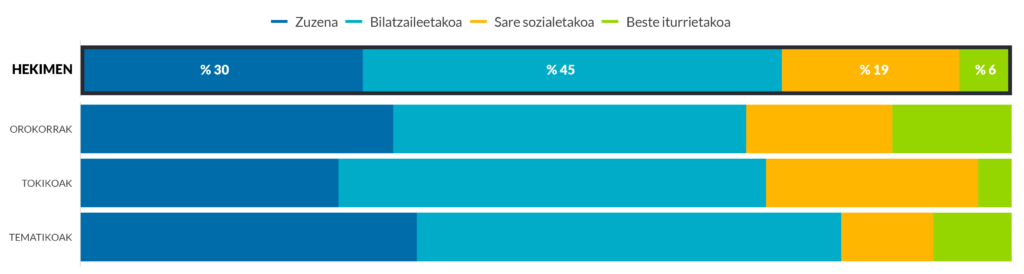
Source: Google Analytics 4, Universal Analytics, Matomo and estimate.
The distribution of traffic sources by type of media shows three significant deviations. Traffic from other general sources (12.8%) and search engines (37.9%) were seven points above the average of the websites of the Hekimen association, measured in 2023, indicating that the general media are more referenced to other websites of their own. Secondly, the proportion of direct media traffic in the thematic group was six points higher than the overall average (36.1%). Finally, the third deviation refers to social networks: in all the premises their weight is almost four points higher (22.8%); of ten visits, 2.3 started on social networks in 2023 and, as can be seen in the individual analysis, in some media began four out of ten sessions on Facebook, X, Instagram, etc.
In general, social networks have decreased in recent years as sources of visits, among other reasons, due to the diminished coverage of news media, the algorithm of the platforms, or the preference of users for the native content of the networks and the increasingly expensive sale of the clique of leaving these environments, that is, due to the influence of internal traffic and the changes in the consumption habits of news.
6. Bye Universal Analytics, hi Google Analytics 4
In this article we present an exercise to learn how last year's audience of the websites of the Hekimen association was, and the first challenge has already been pointed out in the first section. In 2023, the Google Analytics tool, the most widely used among the media to measure the audience of the websites, made an important change, removing the Universal Analytics version from its market until then and leaving only one new one, Google Analytics 4.
In this section we have performed two exercises to better understand this change: on the one hand, we have explained the differences between the two versions and, on the other, we have compared the data that collect both versions to know if they coincide or not.
Let's start with explanations. The main variations between UA and GA4, explained by the characteristics of the new version, are as follows:
Table 11: Main differences between Universal Analytics and Google Analytics 4 based on GA4 characteristics.
|
NON-LIMITED DATA SOURCE: A WIDE RANGE OF PLATFORMS AND DEVICES |
If the communication project includes a website and an application, with GA4 a joint measurement of the navigation produced in both digital environments can be performed. That is, in the new version you can configure multiplatform and multi-device tracking in a single analytical flow, accumulating in it, for example, web and application metrics. This setting is a custom implementation. |
|
EVENTS AND USERS AS AXES |
GA4 is articulated in a model based on facts and parameters, while UA is articulated in a data model based on sessions and viewed leaves.
All data sent to GA4 contain a data model per event previously established in the Firebase Analytics tool. Each event that is recorded separates with the event_name parameter and additional parameters for the event description are added to the name. |
|
HOW SESSIONS ARE MEASURED |
In the GA4 version, the programs start to count on the session_start event, from where they derive. This event is automatically recorded when a user visits an application or website.
The computation of a session starts when a user opens in the foreground a page (web) or a screen (app) and ends when the user stands still for 30 minutes or without any interaction (in the rest sessions have no duration limit). In version GA4, the duration of sessions is calculated based on the time interval between the first session event (session_start) and the last session event. |
|
PAGEVIEWS |
The viewed pages of the UA version are converted to page_view metric in GA4 and this event is also automatically logged. |
|
EVENTS |
In the UA tool it was possible to track some events using extraordinary configurations, the GA4 data recording is based on events, so the most common events are automatically recorded. Automated events such as page_view, user_engagement, scroll or file_download, and other interactions must be configured by yourself through custom events. |
|
COOKIELESS |
Taking into account the General Data Protection Regulation and users’ requests for privacy, the GA4 has launched a system to continue without tracking the information of those who do not accept cookies through Google Protectorate. This will avoid geographically locating these users and their identification, but also accounts for the contents they display in their navigation or interactions with the web. To perform this type of tracking it is necessary to make an extraordinary configuration between the web and the GA4 tool. |
|
LIMITED DATA RETENTION |
In addition to allowing tracking without cookies, GA4 anonymizes the IP addresses of all users and this setting cannot be modified. Likewise, as in UA, all data collected in GA4 are stored on Google servers and do not allow data to be stored elsewhere.
The new version allows managers to choose between two data retention periods, 14 months or 2 months. Therefore, the data retention limit can be adjusted according to the country’s legislation and cannot be stored indefinitely as in the AU. |
|
WITHOUT SAMPLING |
In the UA version, when preparing a large number of data (over 500,000 sessions owned for the selected period), Google applies a sampling, that is, it does not show all data, it is the platform itself that performs a calculation from a small random sample of these data, so the information displayed is not always exhaustive.
In version GA4 this obstacle is overcome by a data model without sampling. This model is based on users and allows exporting all raw data collected to BigQuery, being able to query or query for additional information. |
Source: own elaboration.
Therefore, the UA and GA4 versions do not measure all metrics in the same way, so the questions are essential: will the values of one and the other match? And if they're different, what's the difference? Can we combine the sources into a single analysis? Are they comparable?
We have had the opportunity to answer these questions because most Basque media activated GA4 measurement before the end of 2022 and in the first half of 2023 had a dual measurement underway. With this series of data we have been able to make a first approximation to the previous answers by focusing on the metrics ‘sessions’ and ‘pages viewed’9.
The difference between the two versions of the number of sessions measured on the websites of the Hekimen association in the first half of 2023 is as follows:
Figure 11: "sessions" of the web pages of the Hekimen association, general comparison UA and GA4 and according to the type of media.
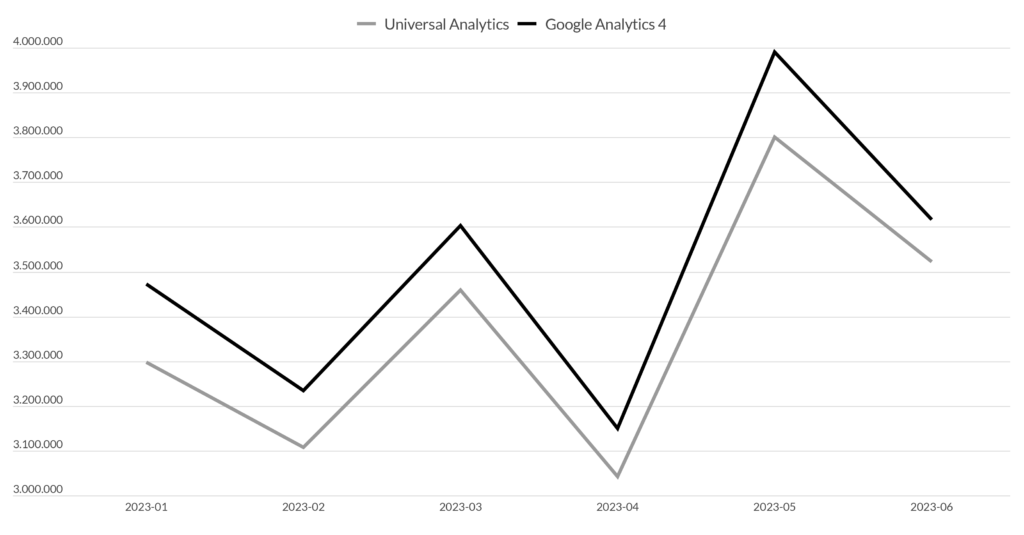
Source: Google Analytics 4 and Universal Analytics.
The monthly evolution of the sessions of the first half of 2023 of all the media measured clearly shows the difference: GA4 counts more sessions than the AU, 4.1% more. However, the difference for all months was not homogeneous, ranging from 2.7% to 5.3%.
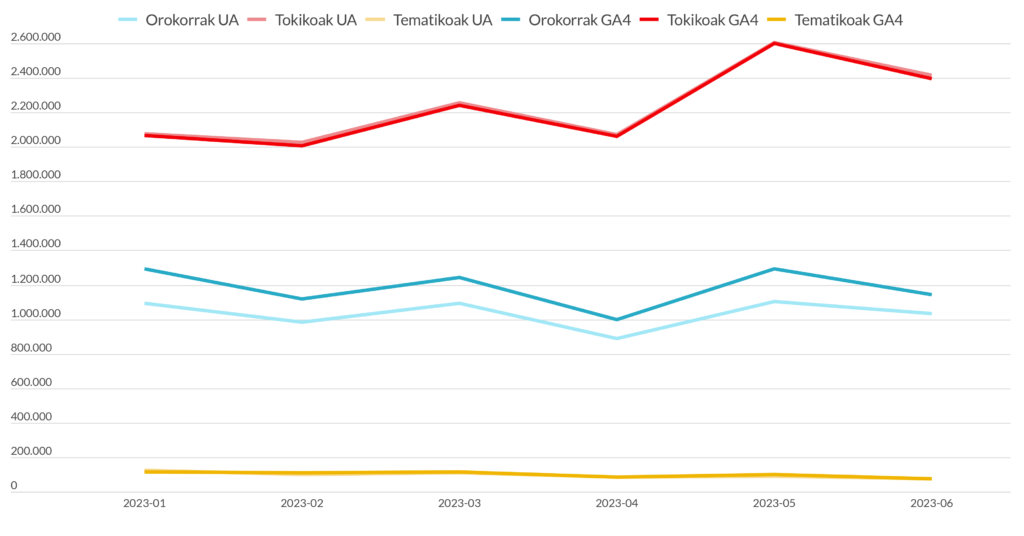
Considering this difference between both versions according to the type of media, the computation was 14.4% more sessions accounted for in the case of generals, 0.5% less in the premises and 2.4% more in the themes.
Figure 12: General comparison UA and GA4 and according to the type of media of Hekimen websites.
Source: Google Analytics 4 and Universal Analytics.
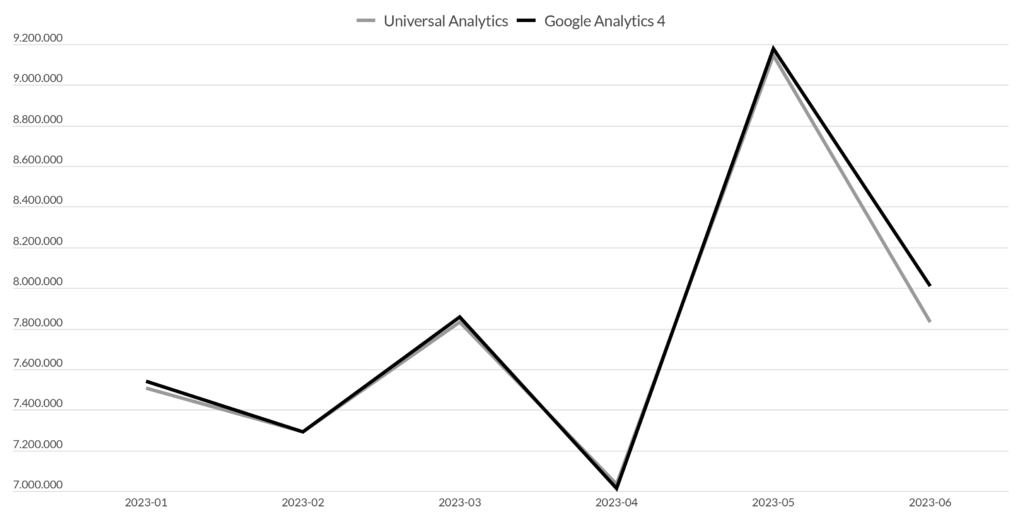
The difference between the two versions of the page count is narrower: GA4 accounts for 0.5% more pages viewed than the AU, and the difference between 2.3% and -0.3% in the first half of 2023.
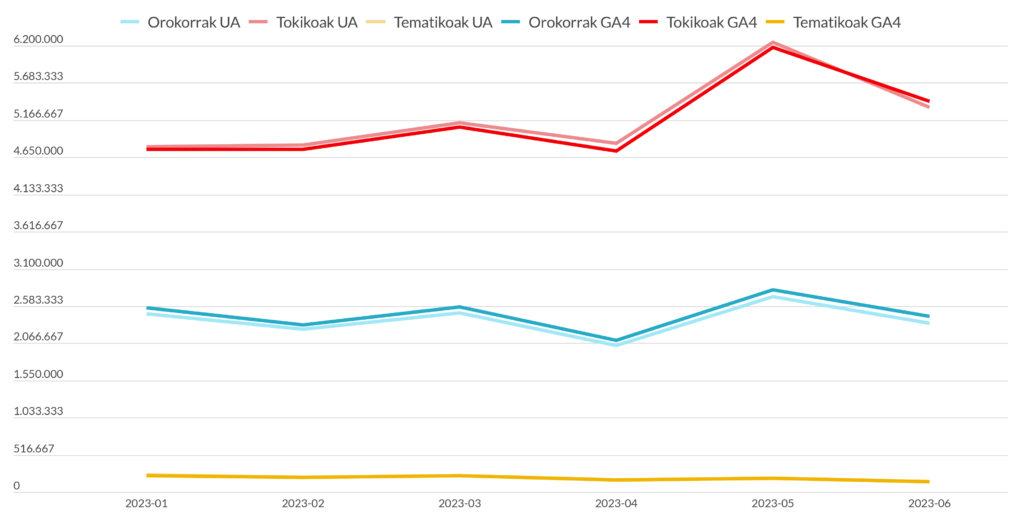
Considering this difference by type of medium, the difference was that in the case of generals GA4 accounted for 3.4% more pages viewed, in the premises 0.8% less and in the thematic ones 2% more.
In the previous exercise we answered the first two questions: the values between the UA and GA4 versions do not match in the two metrics analyzed and the differences are different for the indicator, month, type of media or each media.
Next, we will try to answer the last two questions in order to clarify whether the different data sources can be unified in a single analysis and resolve the comparability between them.
On the one hand, the most recommended practice is not to mix two sources of information in the same analysis, but the standard cannot always be followed. In 2023, for example, the tool itself stopped collecting data from the AU until then and the collection of GA4 data was established as a new reference. It is therefore a combination ordered by chance10.
On the other hand, the change of tool has produced a variance in the measured values, but the results of the analysis of this article conclude that, in the case of visits, the sector has grown above 4% of the growth rate detected in the change of instrument, 9%. In this increase, moreover, the increase in tool change has not been a determining factor: this increase in the media websites of the Hekimen Association has occurred mainly in all the premises, which have grown by 14%, while in the premises, GA4 accounted for 0.5% less sessions than the AU in the first semester of 2023.
On the other hand, no significant differences were found in the metric of the number of pages viewed. Therefore, the change of version of the web analytics tool has had some effect, but it has not been a conditioning factor for the growth of web traffic.
7. Conclusions and new leaps
Once again, in this article we have analyzed the analytics of the websites of the Hekimen association, incorporating a new manantial in the combination of data sources and analyzing the data of the web portals of 50 media. Last year a new version of the web analytics tool Google Analytics has also been included in the game, as well as the derivatives of this change in this 2023 data reading.
Hekimen's media has worked intensively in recent years to transform the network's referential media. In the course of the last decade, new websites have been created, they have invested in adaptation and digital supply, and they have provided resources to respond to the demands of the time, both in technology and in journalism. This path is reflected, for example, in the evolution of web audiences.
In 2023, 40.3 million visits were added, 3.3 million more than the previous year; that is, web traffic grew by 9%. Again, the graphs show an upward trend.
Since Pandemia caused unseen disruptions in audience indicators, the trend in digital media consumption has been uncertain, as it was not clear to what extent the media were able to maintain users and sessions won at the hardest coronavirus. By completing the data series with 2023 values, we have assessed the following interpretations: it is possible that the historical peak of 2020 has passed the marked exception period, that is, that last year we have left behind the incidence of the pandemic. It may still be too early to highlight this fact, but there is an important clue on the line that draws the average mobile of sessions from 2013-2023 (Figure 2). It therefore seems that there has been a leap in the field of digital consumption. In the period 2019-2023, web traffic increased by 41%. The reason may or may not be linked to the pandemic or digital choice for media consumption, but it is undeniable that the media websites of the Hekimen association are more consulted than before. In any case, in this changing land of digital audiences, it is up to us to be vigilant and to follow closely the data for the coming months.
Across the media, the audience has grown unevenly—the locals grew by 2023 (14%) and only slightly the generals (1%)—while some have lost traffic, such as themed ones (5%). Despite the individual observation of the media, the situations are diverse.
The comparison with some media from both Hego Euskal Herria and Catalonia has also undergone unequal changes, although the Basque media managed to maintain or slightly increase their weight in relation to these groups in 2023.
The depth of visits over the years has been more stable than the variability of volume metrics: 2.25 pages per session were viewed in 2023 and the average time of visits was one minute and six seconds. On the other hand, since 2017, mobile navigation is the main way to access the Basque media websites: search engines and direct traffic. On the contrary, clicks on social media have fallen in recent years.
A fact that in 2023 caused important headaches in web analytics is the change from the old version of Google Analytics, Universal Analytics, to the new version, Google Analytics 4. This analysis has tried to measure the impact of the new tool: in the case of visits, the group analyzed in the Hekimen association has increased a growth rate greater than 4% detected in the change of tool, specifically 9%. In addition, the ones that have grown the most and the ones with the most weight have been the premises, in which case GA4 counted 0.5% less sessions than the AU in the first semester of 2023. Therefore, the change in the source of data cannot be considered a conditioning factor for growth, but has had a clear effect, but it cannot be attributed solely to last year’s rise.
In addition, last year, some steps have been taken in the analytical capacity of Hekimen media: on the one hand, BEHA panels have been created to facilitate the monitoring of GA4 metrics and to encourage the use of web analytics in media working groups; on the other hand, training cycles and analyses related to data analytics have been offered.
Not only has it been last year to move from the AU to the GA4, but the year that will mark the end of a cycle and the beginning of a new one.
We are now moving towards a leap: from the reference Hekimen Analytics, used for years for analysis, to the tool Behstrategy Analytics, a new tool that, in addition to web analytics, will incorporate data from social networks and other platforms in the digital environment.
8. References
Azpillaga, J. (2021). Hekimen elkarteko webguneak 2020. Urtean. Euskal Hedabideen Urtekaria 2020, 121–134 or., <https://behategia.eus/eu/urtekaria/urtekaria-2020/>.
Azpillaga, J. (2022). Hekimen elkarteko webguneak 2021. Urtean. Euskal Hedabideen Urtekaria 2021, 133–146 or., <https://behategia.eus/eu/urtekaria/urtekaria-2021/>.
Azpillaga, J., & Lizarralde, M. (2017). Hekimeneko webguneen trafikoaren analisia Hekimen Analytics tresna oinarri. Euskal Hedabideen Urtekaria 2017, 81–96 or., <https://behategia.eus/eu/urtekaria/urtekaria-2017/>.
Azpillaga, J., & Lizarralde, M. (2019). Hekimen elkarteko webguneen audientzia digitalen analisia 2018. Euskal Hedabideen Urtekaria 2018, 123–140 or., <https://behategia.eus/eu/urtekaria/urtekaria-2018/>.
Azpillaga, J., & Lizarralde, M. (2020). Hekimen elkarteko webguneak 2019. urtean. Euskal Hedabideen Urtekaria 2019, 111–136 or., <https://behategia.eus/eu/urtekaria/urtekaria-2019/>.
Azpillaga, J., & Mimenza, L. (2023). Hekimen elkarteko webguneak 2022. urtean eta azken 10 urteetan. Euskal Hedabideen Urtekaria 2022-2023, 137–152 or., <https://behategia.eus/eu/urtekaria/urtekaria-2022-23/>.
Behategia. (2023, uztailak 6). Hedabideak Google Analytics 4ra igaro dira. Behategia. <https://behategia.eus/eu/hedabideak-google-analytics-4ra-igaro-dira/>.
Google. (2022, martxoak 16). Universal Analytics va a dejar de estar disponible—Ayuda de Analytics. <https://support.google.com/analytics/answer/11583528?hl=es>.
Google. (2023, uztailak 1). Google Analytics 4 has replaced Universal Analytics—Analytics Help. <https://support.google.com/analytics/answer/11583528?hl=en>.
1 Hekimen Analytics is a project of the Basque media association Hekimen, created to collect and work with two objectives: to analyze the evolution of the association and use it to improve the comparison of the variables of the different websites. The tool was launched in 2015, but in some media the data are collected from 2012 because of the retroactive nature of the configuration.
2 The number of media outlets and the increase or decrease in audience may be related, but in this case having less media does not imply significant variations, as in the data table last year the weight of this web portal was small.
3 Data monitoring panels GA4, created for the Basque media from the research programme BEHA (Observatory 2023).
4 Figure 1 shows the amounts of each source by order of the data used.
5 Data obtained through Google Analytics are published by OJD Interactive, combining UA until June 2023 and GA4 from July, so they are comparable with ours.
6 These are data related to the entire web, the Basque and Spanish versions are computed together.
7 The four largest media outlets in the list below and in the category ‘Notícies globals i actuary’ have been adopted for the exercise https://www.ojdinteractiva.es/mitjans-digitals-en-catala. : In previous years VilaWeb has also been mentioned, but it left the inspection of OJD and therefore no data are available from 2019.
8 It would be interesting to analyze this hypothesis that has not been explored in this analysis in the next year's work.
9 The monitoring of these two indicators will serve to explain the compatibility of the volume metrics; for other indicators, the different way of measuring between the two versions from the outset prevents comparability, as has been the case in paragraph 4 of depth with the ‘average session time’ metric.
10 The same combinational practice that has been followed in our analysis has been detected in the reports of the Interactive OJD auditor. Likewise, the same logic is followed by the medium that uses a web analytics tool other than Google Analytics.