

Following the studies conducted for the previous Yearbooks, one more year has been analyzed the analytics of Hekimen websites. In 2022, they received 37 million visits, 3.3% more than the previous year. These data have been distributed by type of media and contrasted with other websites to contextualize the evolution of the Basque media. With data from the last year, data from an entire decade has been collected in Hekimen Analytics, which is the excuse for a longer look and a more paused reading. We have tried to do so.
Introduction
In this work we will perform an exercise of analysis of the behavior of digital media in Basque on the network, analyzing in detail the data of the year 2022.
A general starting point: In 2022, 37 million digital media visits were made in Basque Country in Hekimen, an increase of 3.3% compared to the previous year.
It should be taken into account that in 2020 the pandemic drastically changed digital consumption and that until now there has been a trend towards digital media consumption in the coming years, to see to what extent web pages could keep users and sessions gained in the hardest part of the pandemic. In order to achieve this all the media have tried to do so and those of Hekimen have again followed the upward path and made progress.
As in previous years, we have based on data from Hekimen Analytics (HA)1, where the metrics of the 51 websites of the association are collected.
The websites considered in this study are:
- General: Argia 2, Berria, Hamaika TB, Sustatu and Zuzeu.
- Thematic: Hey, Badok, Bertsolari, Dantzan, Elhuyar magazine, Gaztezulo, Hik Hasi, Irrien Lagunak, Jakin, Uztaro, Zientzia .eus and Zinea.eus.
- Premises: Aiaraldea, Aikor, Aiurri, Alea, Anboto, Ataria, Baleike, Barren, Busturialdeko Hitza, Erran, Eta kitto! Euskal Irratia, Euskalerria Irratia, Goiena, Goierriko Hitza, Guaixe, Urola Irratia, Hiruka, Ipar Euskal Herriko Hitza, Irutxuloko Hitza, Karkara, Kanaldude
On the other hand, taking advantage of the fact that 10 years have passed since we started data collection, we have made an effort to analyze the evolution of a decade. The digital landscape has changed substantially over these ten years and a great effort has been made to respond to these changes through different media. We have tried to look at the results.
One fact to start with is that if you look at the whole decade, traffic has tripled.
Visits or sessions
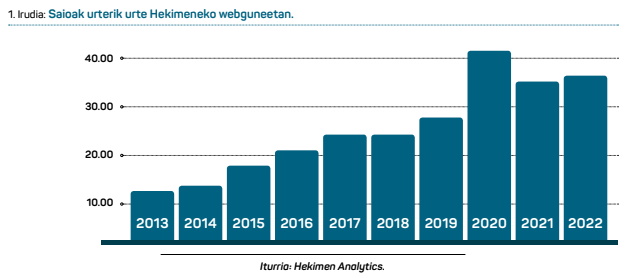
We mentioned in the introduction that Hekimen’s websites have been almost 37 million visits or conclusions in 2022. 36.976,625, more specifically. An average of 101,000 daily visits.
The evolution of these data over the last decade is shown in a table and a graph:
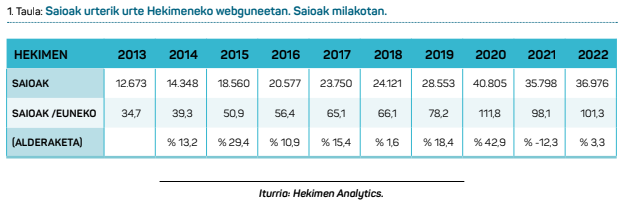
As shown in the table above, there has been an increase in the number of sessions for 2022: 1.2 million visits more than the previous year, 3.3%.
This increase, however, does not compensate for the significant decrease experienced last year, as in the year after the pandemic there was a decrease in traffic of just over 12 per cent, as highlighted in last year’s work. The year 2020 was also special in terms of digital media consumption, and almost 41 million visits per hour have not reached the Hekimen media complex.
However, the upward trend should be maintained. Last year has been the only exceptional year in which there has been a decline in the 10-year series.
If instead of looking at the past year and two years after the pandemic, the look is extended throughout the decade, it must be read differently.
Traffic has tripled in 10 years (in particular it has grown by 292%). In the whole 10-year series, with the exception of 2021, the increase in traffic has occurred in all years, although in a few years it has been somewhat lower than the rest. It maintains its upward trend almost every year.
However, this upward trend is slightly lower in recent times. The intensity of the initial increase appears to have decreased slightly, as can be seen from the graph’s own trend line. Considering the prepandemic series, there has been an average increase of 14.5 per cent over the past seven years, while an increase of 9 per cent over the past three years.
So far we are talking about an aggregate data from all the media of the Hekimen association, as they would constitute a single website in Basque. But that is not the case, and there are great differences between one media and another.
It"s also interesting to take a look at the main blocks. It is recalled that the 51 Himea media are divided into general (5 media), local (34) and thematic (12).
The disaggregated table of the number of sessions is as follows:
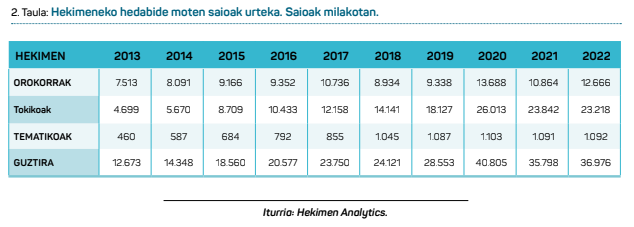
Returning to the trend of the previous year, the general media have increased in number of sessions with almost two million earnings and an increase of 16.6 per cent. Local media show a decrease of 2.5%. And the themes keep the number of sessions last year.
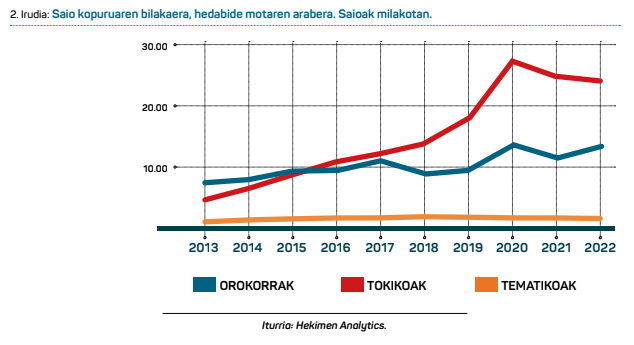
As shown in the table above, of the almost 37 million programs of the set, 23.2 have been broadcast in local media, 62.8%. The general media receives about €12.6 million, about 32.3% of all visits. The topics continue with about one million sessions over the last five years and about 3 per cent of the total.
One of the points to be highlighted in the evolution of this decade is the fact that the weight between groups has changed with respect to visits. In summary, ten years ago, generals concentrated 60% of the traffic in the media, local 37% and thematic 3%, while local 63%, general 34% and thematic 3%.
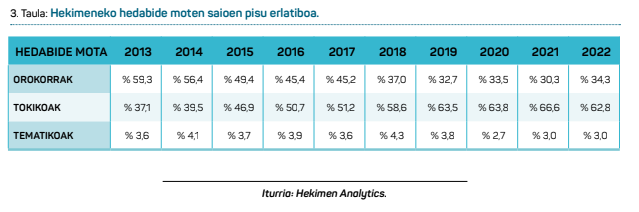
Traffic has grown this way in these 10 years. We almost tripled, as, as we have already said, it has grown by 292%. And, above all, local media have experienced this increase, with an increase in their traffic of 494%; generals have gained 169% and thematic media 237%, approximately, in proportion to the overall.
But of course, in these 10 years, the media map has changed a lot. While we"re measuring 51 websites across the board, not everyone was up and running 10 years ago, which has also meant winning traffic. The possibility has also been opened on the websites in Basque. Has this led to increased traffic? Let us take a closer look at this point.
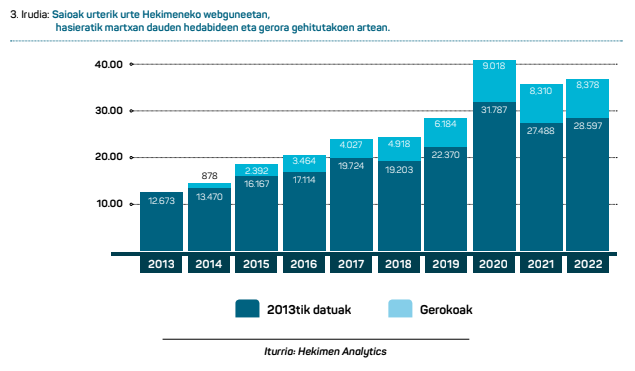
When we launched the RP, we started with the group of 31 websites. Subsequently, 20 new brands have been added to the group4. These 31 and 20, which were operational by 2013 and were later incorporated, will be analyzed in two blocks to see in more detail the distribution of visits.
The distribution in tables and graphs is as follows:
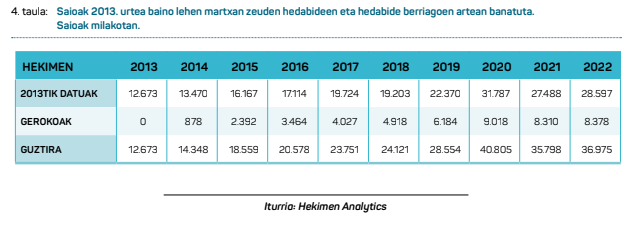
That is to say, out of the 24.3 million revenue, 8.4 million corresponds to the programmes collected by the new brands, while the remaining 15.9 million correspond to those obtained by the old media. The old media accounts for 65.5% of the total number of new brands.
We could also say: If total traffic in Hekimen as a whole has grown by 292%, the old media have grown somewhat less, by 226%. The rest has been won by the new brands.
It must be qualified here. Most new media are local, specifically 16. Four other media are thematic and none of them has been incorporated into the whole in these 10 years. And being the small issues, most of the new traffic that has been won has been in the local media.
In particular, local media has gained 18.6 million visits in 10 years, 8.2 million thanks to new brands and 10.3 million to websites they have been working on for 10 years. Or following the previous comparison, the local media that has been operating since the beginning has increased their traffic by 321% in the last decade, despite the fact that all the locals have increased the number of sessions by 494%.
A small comparison
As in previous years, this year we will conduct a comparison exercise of the number of visits we use with other media in the area, as it can help to indicate whether the traffic data have been good or bad. For this purpose, data published on the network by several media audited by OJD Interactive (Dissemination Justification Office) will be taken into account as comparable to those provided by the RP 5 tool.
Care should be taken with all these comparisons. It would be desirable to know and compare the data of many more media. However, most media do not provide their data openly and each is limited to reading. An account first of all.
Let"s start by looking at other Hego Euskal Herria media: We have access to data from Eitb .eus, Deia, News from Gipuzkoa, News from Alava and News from Navarra. Data from the last 6 years are analyzed.
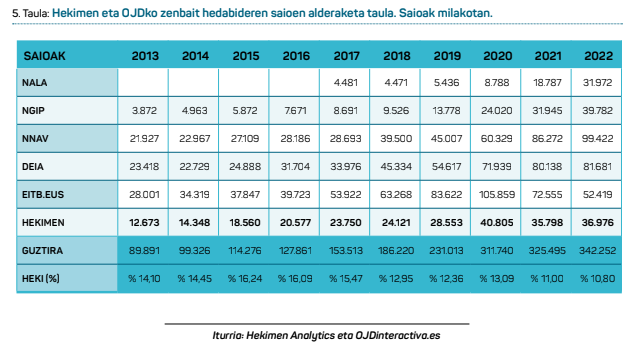
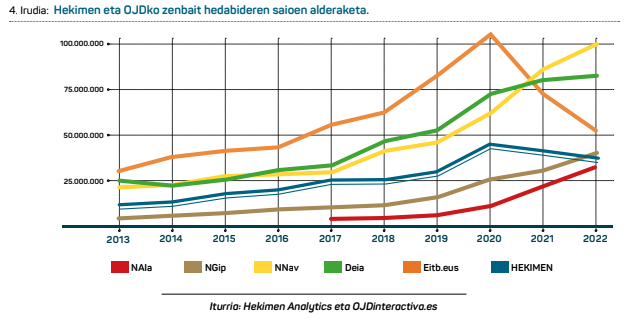
As shown in the table and in the graph, Hekimen is not the only media that has grown in the last 10 years. They have all followed the same trend and the majority, moreover, in greater proportion. If the number of visits of Hekimen as a whole has tripled, the different media in the News group have multiplied the number of sessions by 10, 7 and 4, as have EITB.
This can be observed by performing an analysis of the set. Within the audited set, Hekimen has been losing weight in the last five years going from 14-16% initial to 10-11% current. That is, the number of media programs in Hekimen has grown, but in this case the media analyzed have grown somewhat more.
We could do the same with other media. This section includes several digital media from Catalonia, dedicated to Catalonia 7: The .cat, ara.cat, rac1.cat and diaridegirona. cat.
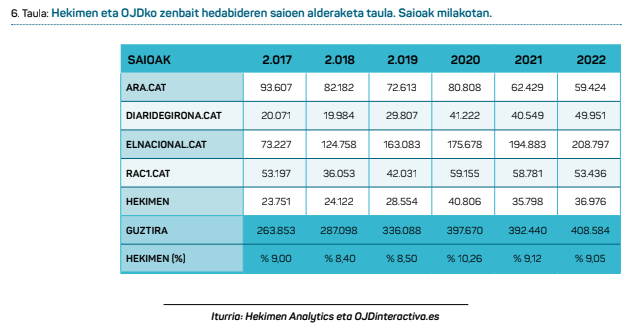
Regarding the media of the table in Catalonia, in the last year the number of sessions have decreased the Ara.cat and Rac1.cat media, while the traffic has slightly increased the Diaridegirona .cat and the largest, Elβ.cat.
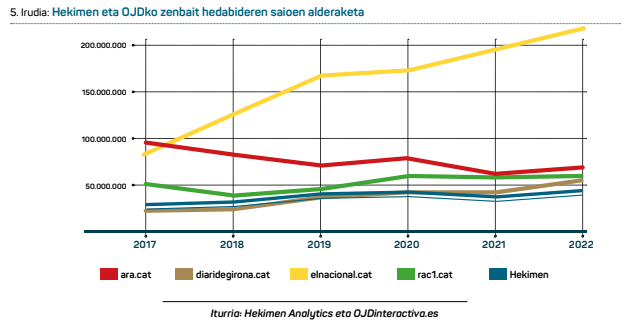
In this case, however, the six-year evolution of the whole is very similar to that of the Initiative as a whole. There has been a considerable increase in Elsoci .cat and a slight increase in Diariodegirona .cat, but the others have not maintained the increase of the whole being proportionally below the same Hekimen. In this group, therefore, our media group revolves around the media.
Other issues related to visits
Not everything is a session or a visit, of course, although in this work we have focused on talking about traffic. The number of users should also be taken into account when measuring the scope of a means of communication and the time each user spends in the medium, for example. These two parameters are also important when measuring the influence of a media.
But in the RP tool, users cannot be compared between different media, nor can they accumulate only quantities between months. This data is also collected in the RP tool, but those of a month cannot meet with those of the following month, as some devices will repeat the visit, and in the same sense, the users of one media and those of another cannot join without more and say how many users the sector simply adds up.
However, we could analyze other characteristics of each session. They seem like some clue.
Some features of the sessions in a small table are:
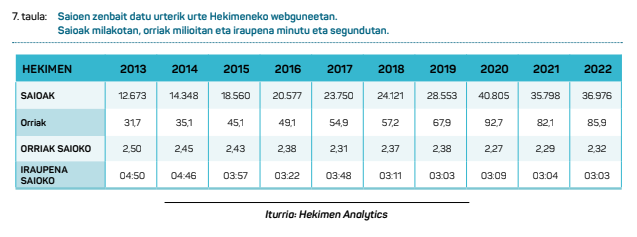
The average number of pages viewed by the user per visit is 2.3, which has meant the reading of almost 86 million pages. It takes about three minutes to read.
The trend is slightly downward in ever-lighter session parameters, less news or pages per session. This probably has to do with the type of visits, traffic sources and devices used. Let"s also look at them a little bit.
Take, for example, the origin of the sessions over the last 10 years. We will only look at the percentages.
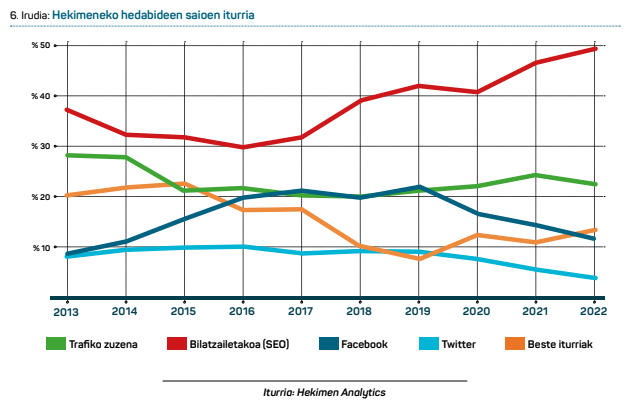
Search engine traffic remains the main source of traffic. It should be taken into account that, in many cases, this source of traffic should be treated as direct traffic, as people search for the “brand” of the media in search engines or write directly the URL or address of a particular news item. For many the search engine is the entry point of the browser’s address and the trend increases with mobile traffic.
Between direct traffic and search engine traffic, the Initiative"s media obtained, according to the RP, 70%.
Facebook and Twitter, on the contrary, have dropped significantly over the last three years as a source of information. The weight of these social networks is decreasing as generating media traffic. Evidently, other aspects such as the internal traffic of social networks, the scope of news media within these networks, or the impact of news on changing consumption habits, are aspects that should be analyzed independently.
Facebook creates 11% of visits and 22% in 2017, while Twitter does not have a 5% current and has reached about 9.5% in 2015.
However, there are differences according to the type of means.
Let"s start by analyzing the percentage of sessions created from Facebook by the type of media.
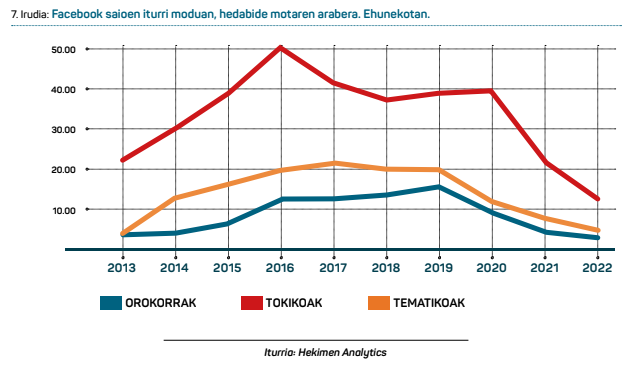
Facebook’s role in creating programmes has been particularly important in the local media. By 2016, half of the news distributed within this social network was generated, while in the general media it was around 20%. By contrast, in 2022, the local created 13% of the sessions via Facebook. There has been a significant decline in all media.
If you do the same exercise with Twitter, this is the graph.
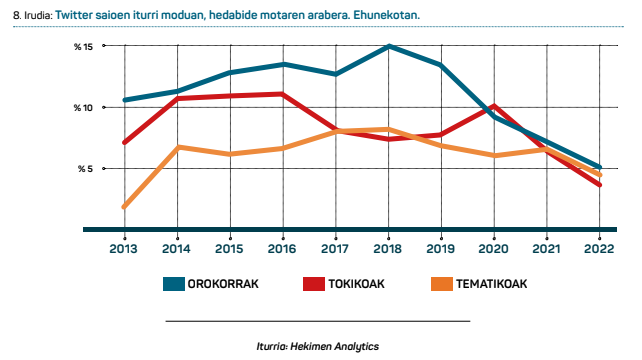
In general, the weight of Twitter is much less. The weight it has among the different types of media is invested precisely in this case: it is greater in the general media. About 15% of the sessions were generated via Twitter in the general media in 2018, a figure that does not reach 5% in the last year.
It may also be interesting to take a look at the devices with which these sessions are performed.
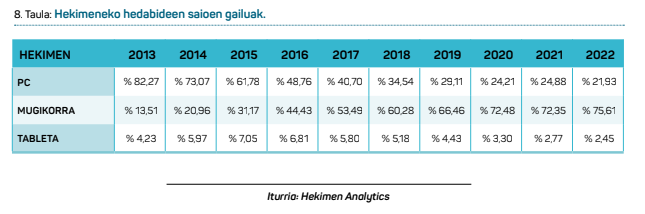
No one will be surprised to say that websites are consumed mainly from mobile phones.
Three out of four visits are made from mobiles and, in some cases, quite more. The evolution could be read differently: computer visits have been lost by about 30% in ten years, mobile visits have grown by about 500%, while the tablet, which doubles the figure ten years ago, still has a very small weight overall. This evolution of data is not surprising from the point of view of current consumption trends.
The phone has been gaining strength according to the type of media.
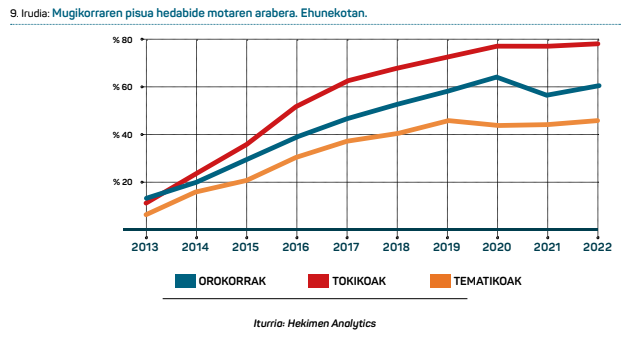
The data shows what is otherwise evident, mobile is the main means of news consumption. However, it is the local news that has gained the most weight: 78% of the sessions are held from this device, keeping the weight of the year of the pandemic in the last two years. On the contrary, in the general media the mobile phone is around 60% and in the thematic ones around 46%.
Finally, we will detail the number of pages of the aforementioned session, making a reading by type of media, as there are some significant differences.
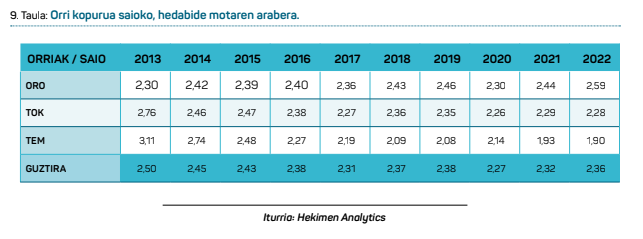
The user sees more pages in the general media per session, if an average of 2.36 pages are visited, about 2.6 are visited in the general media, in the premises 2.3 and 2 below in the thematic ones. In addition, the trend has changed in the last ten years, since by 2013 the number of pages that were delivered was higher in the themes and in the local than in the general ones.
To conclude
This article continues with the work carried out in the last four or five years, taking PR data and analyzing the joint analytics of 51 websites in Basque. General trends hardly vary from year to year, but monitoring comes well in the effort to measure their intensity and capture possible news.
This year, moreover, we have tried to make a broader reading of data over a decade without focusing on data over a single year. Ten years are many.
Hekimen’s media package has worked hard in recent years to become a network reference. Along the way, new websites have emerged that have provided more journalistic and technological resources than before.
All of this has borne fruit: traffic has tripled in ten years and with the exception of the year after the pandemic, the media as a whole has maintained a growing trend every year. It"s a lot.
Media consumption has changed over the years. Computers ten years ago are mobile phones where you read, see and hear news. Social networks took on great importance between 2013 and 2019 or 2020 as a source of media traffic, but in the last two or three years Facebook and Twitter have lost weight. This does not mean that social media has lost weight, of course, that they no longer bring so much traffic to the media, but more. We have seen that in the various media there are also different programmes, that there are some nuances depending on the type of consumption.
It is therefore a great deal of effort and the framework that has been won over all these years. We have often said that the little one always has more difficulty maintaining his space, and more on the net. And digital media in Euskera, even adding 51 sites, are still small. Very small.
That is why we have to remember the couple of notes that were issued last year, adding some new notes.
One: the upward trend seems to be moderating slightly. The number of sessions has also increased in the last year, but we are below the starting percentages of the decade. It seems that it costs more to attract new people and get their attention in more time and more periods. This is demonstrated by the comparison with the local media, although this comparison must be taken with caution: the other media in the area have grown more, at least the majority. There could also be the temptation to subtract the importance of this slowdown somewhat with the suspicion that this is normal and that certain media outlets have reached a high point, but it does not seem that the number of sessions that are obtained and the proportion of attention that is given gives a serious reason to think about it. And a change in the intensity of trends can lead to a change in the same short-term trend. It would be a matter of looking cautiously.
Two: there are big differences between the media. The locals have gained notoriously in these 10 years, due to the growth of the new and old media, but the latter has also somewhat remained this trend. Generals get more quality programs and maintain their weight in the years after the pandemic, but it seems that maintaining them is enough. The topics, on the other hand, constitute a good number of media, but they do not manage to skip traffic. Each type has its characteristics, we have to analyze its possible users and consumption habits, we have to compare with the trends of other similar media and we have to delve deeper into this reading, but there are sufficient reasons to include them in this view. In addition, the great differences do not only exist between the local, the general and the thematic, but there are also great differences between them in each group.
We know that the media do not have the number of programmes and clicks as its sole objective. The scope, the impact, has to be measured in many ways. Even in the network itself there are interesting metrics that we do not even mention here: users, attention time, number of feedback received, set of characteristics of the interactions that have occurred… And in the path that is now spreading through the media, funnel or categorization of users: number of visitors, number of users logged, number of subscribers, number of partners, number of buyers, etc. Measures can also be taken largely outside the media about the impact on social networks themselves, e-posta newsletter subscribers, podcast listeners, video viewers… All of them are more the metrics a media media can or should take into account and only a few are available in the RP.
In this work this year we have carried out the activity with which we have at hand, convinced that the ones used also serve to detect the trends of the other parameters. In its simplicity, it will serve to acknowledge and thank the enormous work that the media have done over these 10 years and to help in the future.
1 Hekimen Analytics is a project of the Association of Basque Media Hekimen designed to collect some analytics from the websites of the association and work with two objectives: to analyze their evolution within the association and to take advantage of the tools to improve by comparing the variables of the different websites. The tool was launched in 2015, but in some media data are collected from 2012.
2 The light data are offered by the Matomo tool. All other media belong to Google Analytics.
3 We define as a visit or session the set of actions a user performs until entering and leaving a website. A particular user can perform several sessions throughout the day on a Web page; each session has a duration of X seconds and visits the Y page in each of them. In this work we will use the words session or visit, both with the same sense.
4 New media have been defined as the same regarding problem-solving. However, some of these 20 were also operational by 2013, despite the lack of digital analytics and subsequent addition to the RP tool. For the purpose of this work, new media are considered.
5 The same OJD mentions in the above-mentioned summary media measurement reports that data collected by Google with the Google Analytics tool.
6 OJD shows five-year data on the web, to which we have added some compiled. In all cases there is no complete set of data.
7 To perform this activity, we have taken the four largest media from this list and from the category “Notícies globals i actu>” https://www.ojdrecono.es/mitjans-digitals-en-catala. In previous years VilaWeb has also been mentioned, which abandoned the OJD inspection and therefore there are no data after 2019.