

The web analytics of the Hekimen association have been analyzed once again with the largest collection of web analytics data in Basque in history: Audience data from 60 media outlets has been added—the measuring universe has grown by 20%. In terms of the number of visits, the mark of 40 million sessions has been exceeded once again and a significant increase can be seen in the data, with a 42% increase in Basque media traffic over the last five years. We have divided these data by type of media and compared them with other websites to contextualize the evolution of the Basque media. The analysis by type of media, grouped into general, local and thematic, shows different photographs looking at the volume of visits or the depth of visits as well as the size of web communities. For this reason, we conclude this year’s analysis with a reflection on the most appropriate metric to know the evolution of web traffic and the state of communication in Basque, as well as a review of the Behategia Analytics panel that will allow measurement beyond web traffic in the near future.
1. Media list, data sources and methodology
In this study, we investigated the behavioral data collected and collected by the 2024 audience of the Basque language websites of Hekimae. This work is renewed annually (Azpillaga, 2021, 2022; Azpillaga & Lizarralde, 2017, 2019, 2020; Azpillaga & Mimenza, 2023, Mimenza et al., 2024), and as usual we have received the historical data from the Hekimen Analytics1 tool, while those from the last two years have not: We have extracted data from the BEHA panels and Behategia Analytics for the years 2023 and 2024.
Compared to the previous year, this year 10 media outlets have been added to the study, going from 50 web pages last year to 60 this year, which represents a 20% increase in the measurement universe.
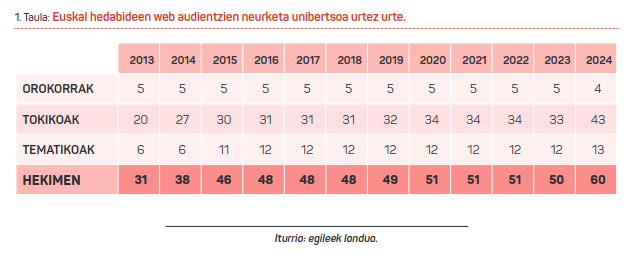
The number of media outlets measured by website audience analysis has nearly doubled since the first data collection in 2013. Likewise, from 2023 to 2024, the universe of measurement of web audiences in the Basque media has undergone two main changes. On the one hand, the nature of a medium has changed in its classification; it has moved from the general media group to the thematic group because it better fits this criterion. On the other hand, the measurement on the websites of 10 media outlets has been added to the local group, some of which have now launched the measurement of web traffic and others have been created this year, increasing the number of media in this group from 33 to 43, an increase of 30.30%.
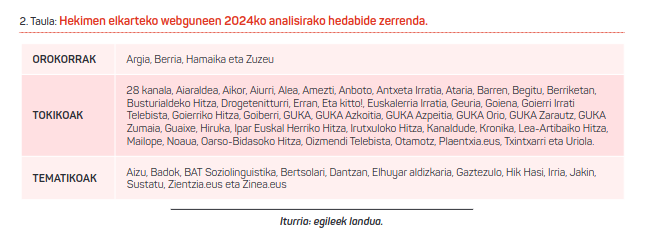
In addition, it should be noted that some media outlets have had a change of name during 2024, such as the portals of the GUKA communications group and/or the magazine Irria. Accordingly, they are referred to in the present study under the new designation. The following table lists the websites measured for this year’s study:
It is impossible to bring data from a single source, for which the tool created a decade ago, Hekimen Analytics, stopped collecting data in July 2023 (Mimenza et al., 2024). Like last year and beyond, there are two sources of web analytics data: Google Analytics and Matomo (to collect data that is measured using these tools using BEHA platform2 and Observatorio Analytics3).
Data from 59 portals of 60 media outlets are automatically collected through Google Analytics, which can be consulted in the BEHA panels (daily) and in the Behategia Analytics tool (monthly). For its part, a communication medium uses the free software Matomo installed on its server for the measurement of web traffic and this data is added to the rest in the Observatory Analytics panel.
The values of the metrics selected for this analysis have been collected on a monthly basis and the proportion of data sources used to form the 2024 data table has been distributed as follows: 98.05% Google Analytics, 1.67% Matomo and 0.28% estimation4.
The following pages present the results of the data analysis in sections: first, the growth of web traffic is analyzed by observing the number of sessions, then this traffic is compared with the volume metrics of other media, in sequence the origin of the audience is observed from which devices and traffic sources occurs, and finally the indicators of depth of traffic, the number and time of pages in the session, and the size of web communities, taking into account the users and types of users.
2. Web traffic keeps growing
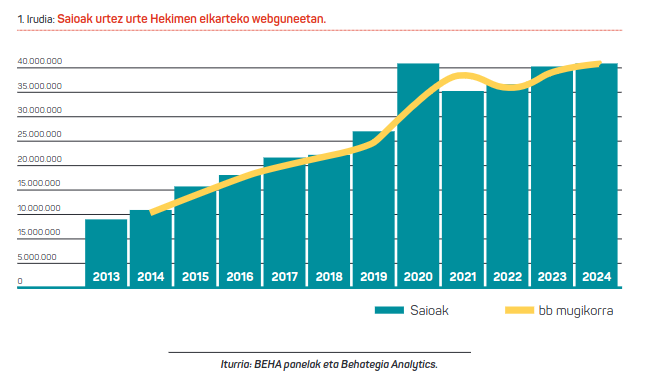
In 2024, the number of visits to the Basque media websites of the Association Hekimen was again exceeded by 40 million: A total of 40,677,242 meetings were held, an increase of 0.92 per cent from the previous year. This annual data reveals that there have been 111,444 sessions per day, a thousand more visits per day than in the previous year. The sector is approaching the historical peak of the pandemic year, maintaining its annual increase.
The following table and graph shows the evolution of the years:
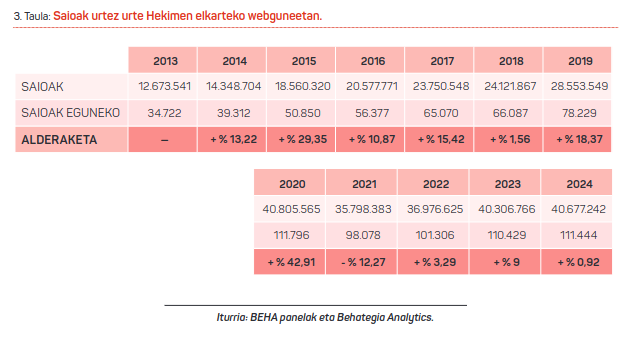
Compared to last year, in 2024 the number of visitors to measured websites increased by 370,476, which represents an increase of 0.92% in web traffic5 for the entire Initiative.
Looking at the five-year perspective, there has been a significant increase in the period from 2019 to 2024, with a 42.46% increase in Basque media traffic before the pandemic to date and from the extraordinary data recorded in that historic annual peak of the pandemic —2020. to reach the mark of 40.8 million visas per year — the figure remains very close in the last two years, at almost 500,000 in 2023 and just over 128,000 in 2024. In other words, this alteration led to a growth that has been sustained since then, a difference of only 0.3 percentage points if we compare this year’s data with 2020.
The 60 media that have been measured are varied and can also be classified among the main and lower traffic attractors:
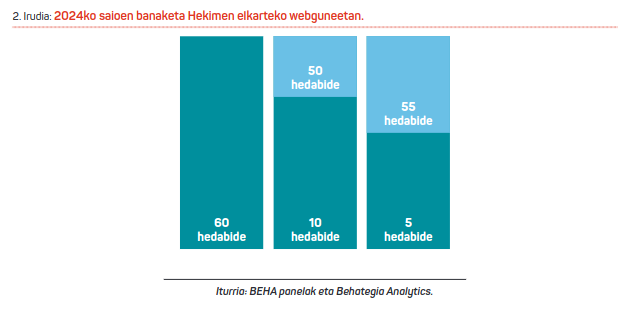
As shown in the figure, the group includes high-traffic media: among ten media outlets, 71.33% of the visits of the 2024 association have been accumulated, even among five media outlets, passing half of the traffic, 54.24%. The evolution of these media, which have the greatest weight as visitors’ creators, is important in the sector, but also the performance of the 50 media that make up the group of lower traffic.
2.1. Evolution of web traffic by type of media
Although it is important to measure the traffic of the Initiative’s websites in an aggregate way, the Association’s media form groups of different nature, and it is also advisable to observe their concrete evolution. The groups have been differentiated according to the type of media (see Table 2): 6.67% of the media are of a general nature - four websites measured in this study -, 71.66% of the local ones - 43 websites - and 21.67% of the thematic ones - 13 websites.
Unaggregated table of the number of sessions per media type in succession:
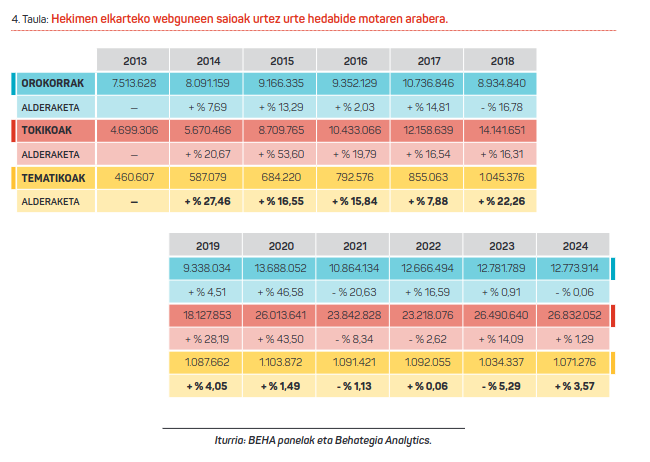
According to the measured values, the thematic ones have been the ones that have increased the most this year —the group has increased 3.57% since 2023, almost 37,000 visits more—, the group of local ones has also increased —1.29%, 341,000 visits more—. According to this distribution by type, the most general is the only group of media that has lost visits: almost 8,000 fewer visits than in the previous year -0.06%.
It should be noted that in this year’s ranking the general media is one less, while the local media is ten and the thematic media is one more. It is therefore appropriate to understand developments in context6.
Up to 10 more media outlets have been measured than last year, which has caused the growth of web traffic
- Increase/Not Increase of Topics: A medium of significant relative weight has been added to this group since the last year, and this incorporation explains the positive evolution of the topics this year - the group would have decreased by -3.74% if this new website had not been added.
- Increase/Not Increase of Locals: Locals have grown this year thanks to the incorporation of new media in the measurement, thanks to more than one million visits of the 10 new websites that have been specifically added; otherwise, the group would have a negative evolution this year, down -3.03%.
- Drop/no drop in Generals: this drop is due to the media that has changed groups in the ranking, because otherwise the generals would have kept last year’s audience, held it and grown a little – almost 68,000 sessions, 0.53%.
By nature, the trend of thematic and local has been decreasing this year, while the more general trend has not.
Likewise, the aggregate added to the measurement of the number of media also affects the evolution of the general data of the association Hekimae, since if the new media had not been added to the measurement the aggregate audience of the group would have decreased by almost two points - 1.92%.
Not only do each set have a different number of websites, but the dimensions of the number of sessions are also different. To neutralize this, the following image shows the evolution of each group in its scale, and looking at the moving average you can see more clearly the fluctuations of media of different nature:
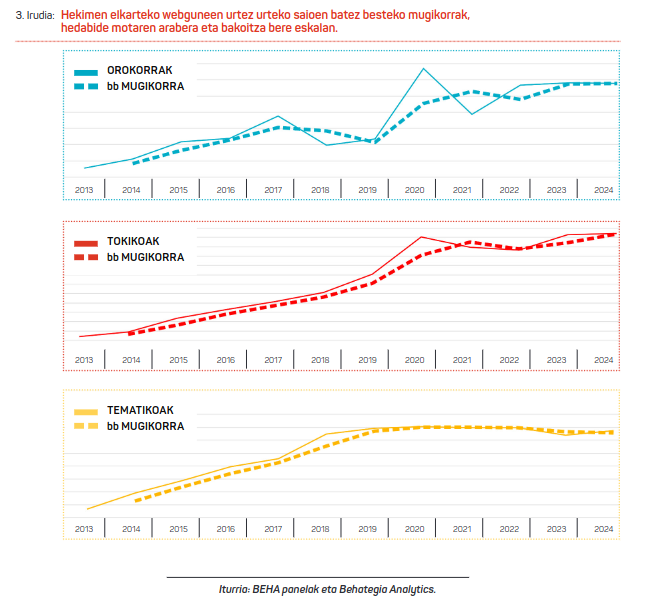
The increase in the last eleven years is evident in the three groups, both in absolute values and if we look at the moving average. The dashed line that graphically shows the trend shows a sign of possible saturation in the generals in the last two or three years and in the thematic ones before the pandemic here—as has been pointed out, the locals maintain the rising trend thanks to the measurement of new media.
Elections to the Basque Parliament and 23. Running, audiences up
Looking at last year’s month-to-month traffic evolution, April has seen a slight increase in traffic in the general media as a whole, possibly due to coverage related to the general elections. There is also a means of communication 23. The high coverage of the race led to a five-fold increase in its traffic in March 2024.
The group that includes the largest number of websites belongs to the local media – the list in this study includes exactly 43 media – while the locals have the greatest weight in web traffic. However, there is not always a direct correlation between the number of media and traffic, as a smaller number of media may have a significant weight—as is the case with mainstream media.
The following table and graph shows the evolution of these weights by type of media year after year.
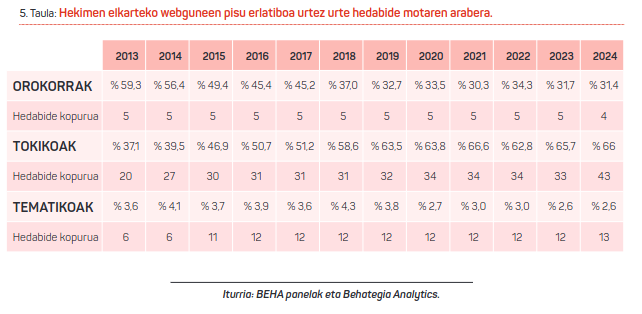
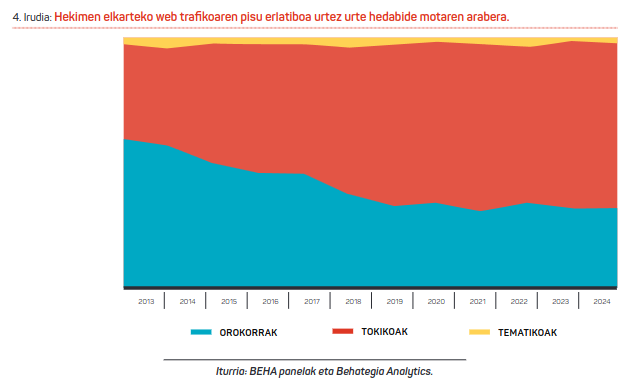
The distribution of the relative weight of the sessions accumulated by the sector in 2024, according to the type of media, is dominated by the local ones in the volume of traffic. This is due to the number of local media that have been added to the universe measured for this study in recent years and the increase in the audience of local media. However, the general audience has grown relatively more: in the last five-year period, taking into account data from 2019 to 2024, the general audience has grown 36.79% with the accounting of one less medium in the group that is measured, while the counting of traffic of 11 more websites in the local group has increased the general audience by 48.02%. That is, the locals have grown more, but they are more. The same phenomenon has also appeared in relation to last year (see the comparative note of last year’s and this year’s traffic growth measurements in some lines above).
3. The growth of web traffic beyond the Hekimen association
As in previous years’ studies, once again this year a study has been carried out to compare the data of the number of visits of the media of the association Hekimen with the other media of the area, which can help in the interpretation of the results of the traffic. This is based on the data published on the network by different media under the supervision of the Interactive OJD (Office of Justification of Dissemination), comparing the information offered by this entity with the data collected for the 2024 analysis7.
Again this year, it is recommended to interpret the following comparisons carefully. To obtain a more accurate and complete result, it would be ideal to be able to know and compare the data of more media; however, most media do not share their data openly, and each one performs the interpretation according to its own criteria. Therefore, it is important to keep this in mind when reading the data.
First, we will focus on other media in the Southern Basque Country: Noticias de Álava, Noticias de Gipuzkoa, Noticias de Navarra, Deia and eitb.eus8.
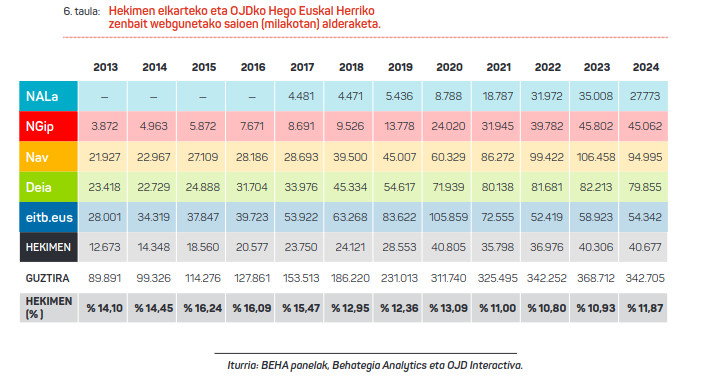
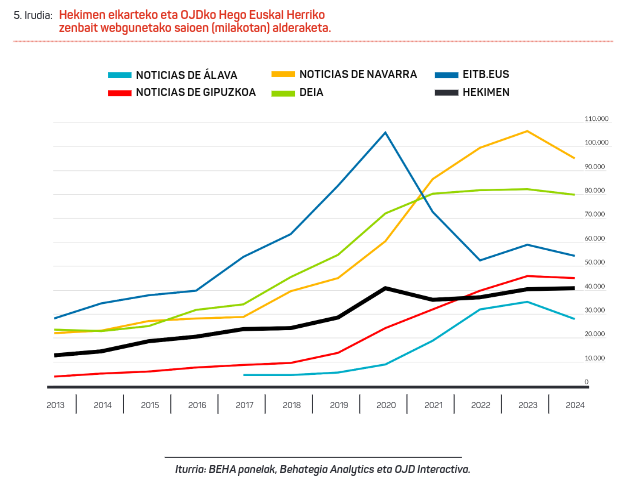
Analyzing the data of the last year, the Hekimen association was the only case with a growth rate (0.92%), and its traffic volume reached 11.87% of the measured totality -passing a point -.
On the other hand, although Noticias de Gipuzkoa has more or less remained in the data of the previous year (with very little decrease, only 1.62%), the rest of the media has lost millions of visits. Both eitb.eus and eitb.eus, for example, have experienced consecutive declines of two to four million visas—although this represents a 2.87% drop in traffic volume in Deia, resulting in a 7.77% loss in eitb.eus; and Navarra News and Álava News, which have experienced more significant losses, with 11 million (10.77%) and 20.7 million (20.67%) visits, respectively. While the trend of the first two remains relatively stable, the last two show a clear downward trend.
In the same way, we can do the same exercise with other media. Below, we analyze several Catalan digital media that operate in the Catalan edition 9: ara.cat, diaridegirona.cat, elnacional.cat and rac1.cat.
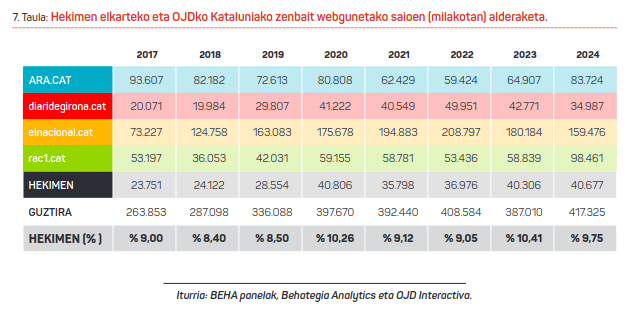
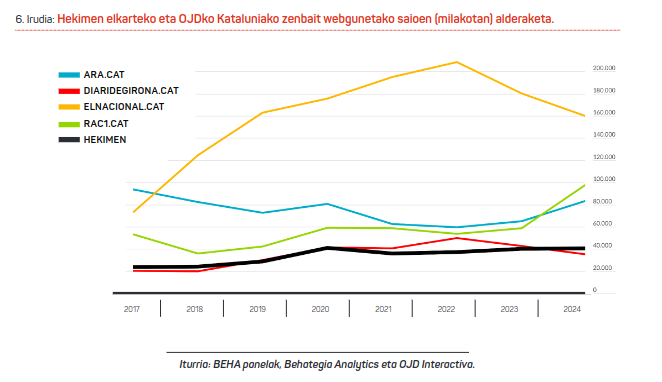
The evolution of the Catalan media this year has been more pronounced than that of the Basque media, both in the ascents and descents. rac1.cat is the fastest growing with an increase of 40 million visits (up 67.34%), followed by ara.cat with an increase of 18 million visits (up 28.99%).
On the other hand, the decreases were also high: diaridegirona.cat lost 7 million visits (down 18.20%) and elnacional.cat 20 million (down 11.49%). However, despite the latter’s declining trend, it remains one of the most consumed media in Catalonia. The weight of the initiatives has remained similar over the last eight years audited.
4. Origin of the audience
To reach a media website, users can use different channels, and the identification of these traffic sources is essential to analyze the strengths and weaknesses according to their respective strategies. In addition, the origin of the visits also influences the quality of the sessions. The devices and traffic sources through which the audience is acquired are discussed below.
The following table shows the proportional evolution of the number of sessions of the HinitiativeAssociation websites by device type.

According to data from 2024, the most used device to access the website is mobile, with the origin of seven out of ten visits. Then, the computer weighs 24.81%, and finally, the navigation from tablets and other devices is only 2.35%.
The trend in recent years shows that from 2018 onwards, mobile access has prevailed over computer navigation —2017. Since that year, mobile traffic has increased to half of the traffic. Mobile data is stable for the fifth consecutive year, since the pandemic year, more than 70% of Basque media visits start on mobile phones.
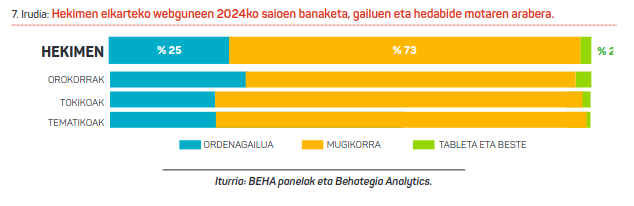
Depending on the type, the majority of the media are above average in the locals and in a 20% of the group the predominance of mobile is even more evident—with eight out of ten visits or higher at these rates. In both local and general cases, only one case has been found in which mobile visits do not reach half. On the contrary, the behavior of the thematic groups is completely different: in most of the media of this group, 77%, mobile navigation does not reach half, even with rates of 20%, so in the thematic groups the computer predominates.
If we analyze the evolution of 2024, as in previous years, it is observed that the relative weight of mobile phones increases during the summer season; although traffic from this device decreases slightly during these months, it maintains the annual average, while computer visits decrease significantly during the summer season, down a notch in July and to about half of the rest of the months in August. This can be explained by two main reasons: first, in the locales, the decline coincides significantly with the vacation time of the media workers and the associated lower production; and secondly, one can think of the general loss of navigation in pre-computer working hours.
The following table shows the annual proportional evolution of visits by traffic source:
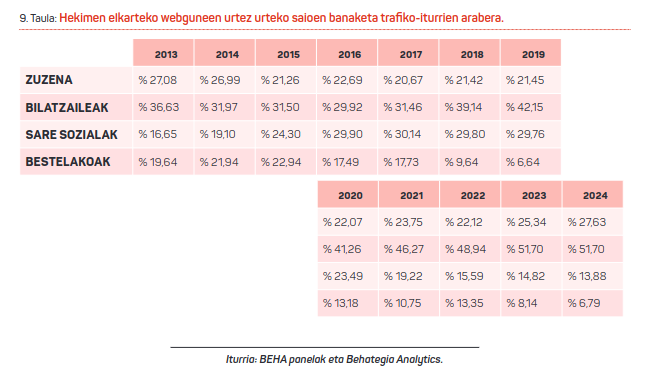
According to the analyzed data, search engines have always been the main source of traffic to access the portals of the Basque media, with a weight of 51.70% in 2024. It is necessary to carefully consider the audience that is classified as organic traffic in the category of search engines, because sometimes it happens that although we know the URL, we look for the name of the website that we want to consult in the search engine and that audience that should be treated as direct traffic in itself is camouflaged here.
Since the last year, direct traffic has increased by two points. Behind this can be the rise of channels in messaging apps or the expansion of the email newsletter offer, both of which share direct URLs to access the news. It should not be forgotten that dark social10 visits – and henceforth also dark AI are counted in this category.
Combined with direct traffic (27.63%) and search engines, 79.33% of the visits reach the Basque media through these channels; these are the relatively main accesses, although the first is direct access to the media and the other is mediated.
Although the place of social networks in the information society is high, they are not a significant source of traffic to portals; although they served to reach a third of the audience in the period 2016-2019, for the second consecutive year in 2024 they have not reached half of that rate. In recent years there has been a tendency to prioritize its own content on social networks and to develop native communities with users, and not so much the practice of using social networks as attractors of web traffic, among other reasons: on the one hand, because platforms have limited the organic reach of the media in order to support their advertising systems repeatedly in recent years; and on the other hand, because users prefer native content on networks and the click that comes from leaving these environments sells more and more expensive, that is, because users’ social media choices are increasingly favored and consumed by the habit of consuming news related to natives.
Finally, 6.79% of the 2024 sessions have reached the websites of Hekimae from other sources. These include referral traffic, i.e. visits coming from other websites, such as through links on blogs or digital newsletters, which also include references between Basque media in this category.
To conclude with the analysis of the origin of the audience, we observe how the distribution of traffic sources varies according to the type of media:
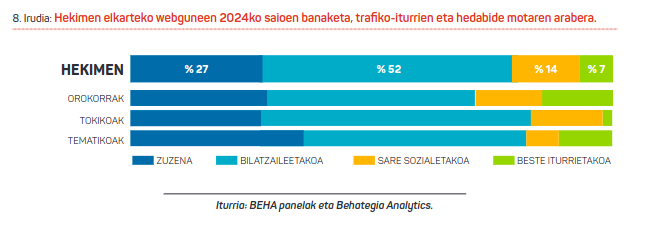
As in the aggregated data of Hinitiative, traffic in search engines is the primary source of traffic in all types of media. However, in the local media the search engines have a greater weight, 56.07% of the total—that is, the origin of most traffic.
In terms of direct traffic, it is higher in the thematic media (with a weight of 37.19%) than in the other groups and aggregates.
Regarding the traffic of social networks, they have a very low weight in the thematic media (6.50%) compared to other types of media (13.37% in the general and 14.45% in the local).
Finally, it should be noted that traffic designated as another source has very different weights depending on the type of media—while it weighs 2.34% in the local media, it rises to 15.22% in the general media.
5. Depth and size of the audience
Not everything is a session or a visit, of course, although we have focused on this metric so far when talking about traffic in this work. For example, it is necessary to consider the depth of the sessions—how many pages of the session are viewed or how much time is spent viewing, listening or reading the contents of the websites—as well as the number of people who reach the websites. The depth and size of the community are important parameters in the analysis of the influence of a medium, so these axes will be addressed below.
We will start the analysis with a calculated metric associated with the depth of the visits: the number of pages consulted per session.
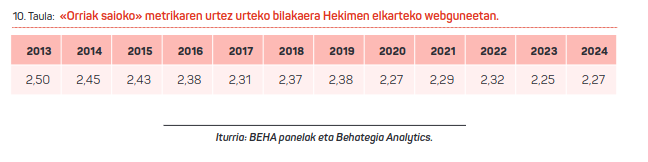
An average user sees 2.27 pages per visit: 2.24 in general and 2.49 in thematic, while 3.30 in local, i.e. more. This session depth indicator has remained very stable at the overall level for all measured years (see Table 10).
As a result, in 2024, 92 million pages (92,230,364 in particular) were read on Hekimae websites, an increase of 1.46 million compared to the previous year. Depending on the type of media, the value of the number of pages viewed has decreased in thematic and general terms, by almost 66,000 and 1.8 million respectively, with a gain of 3.3 million in local pages.
There is another metric that provides information about the depth of sessions, which is the length of time that visits last, that is, the duration of the attention of attracted users; in fact, one of the main challenges of the network today is to access and maintain the attention of the user.
On Hekimae’s websites, the sessions typically lasted about a minute over the past year – exactly 59 seconds.
The 2024 data of the average indicator in the session below, by type of media:
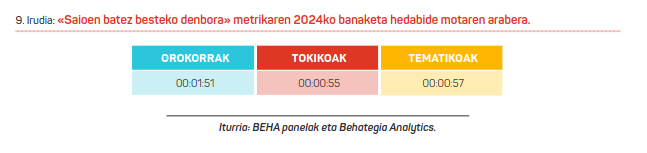
The local and thematic sessions were very similar to the average length of visits to the Hekimen-associated websites, but longer than the general group sessions, which were 52 seconds longer. In contrast to the values of the year 2023, the generals have gone from minutes and 24 seconds to almost two minutes, while those of the other two groups have gone down slightly. Therefore, the most general media is the group that has managed to increase the duration of the attention of users in the evolution of the last year.
If we multiply the average time of sessions by the number of sessions in each group, we can observe what the relationship of attention acquired by each type of media in 2024 is:
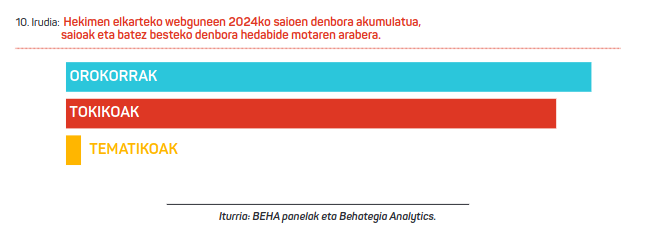
It was the general media that accumulated the most time, followed by the local ones and, conditioned by the number of sessions, the thematic ones on a much smaller scale.
Therefore, the focus will be on the number of people who reach websites in this final part of the study. The overall size of the Hekimae media web community cannot be calculated, as the number of users of one media and another cannot simply be added, because in many cases the users of one media and those of another can be the same—you can first access a general media portal, then a local one and then visit a couple of topics, in which case you are the only user who has visited four media, so the users of each media cannot join. For this reason, we will take a different approach to the sizes of web communities.
A question to start the approach: what is the size of the smallest community and how many users has the largest?
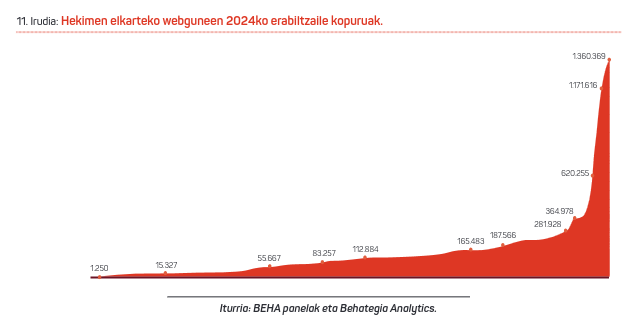
As shown in the image above, in 2024 the web with the smallest audience among the Basque media reached 1,250 users11, bringing together 1.36 million users in the largest web community12.
According to the type, the largest web communities are concentrated by half of the general media; and, in harmony with what has been shown in Figure 2, if you divide between five media outlets passing half the traffic, the first four media of this ranking are also those with the largest web communities.
To observe this link, the relationship between users and sessions has been represented in the following graph.
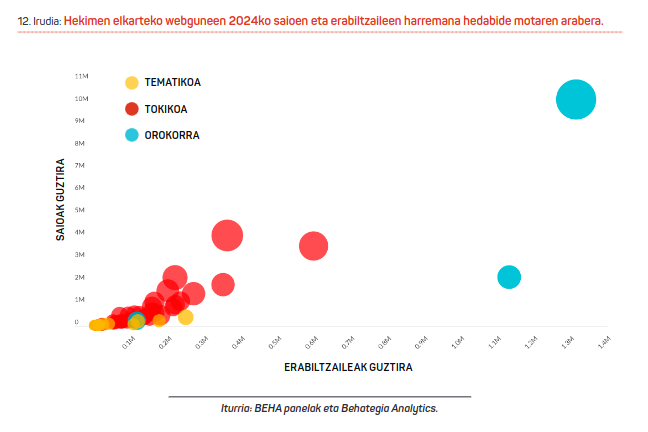
In the image you can clearly see the four largest web communities, the two largest mainstream media that are located in the Eskuma area and the other two locales that appear in the middle, which, despite accumulating more sessions, reach fewer users.
There is an important issue here, the size of the web communities is determined from the beginning by the very nature of the media: being a media of general vocation opens the possibility of reaching all Basque citizens; in the case of local media, the potential is defined geographically, it is not the same whether it is a regional or local media, or whether it is located in a sociolinguistic or other field; and, on the contrary, with a specific thematic goal, the starting point is the citizen who has this interest. As a result, comparing the sizes of different media web communities doesn’t make much sense.
High, there is another dimension of interest in the analysis of the user area, the typology of these users: users who make one session per month or "occasional", users who make two to five sessions per month or "loyal", and users or "fans" who make six or more sessions per month 13.
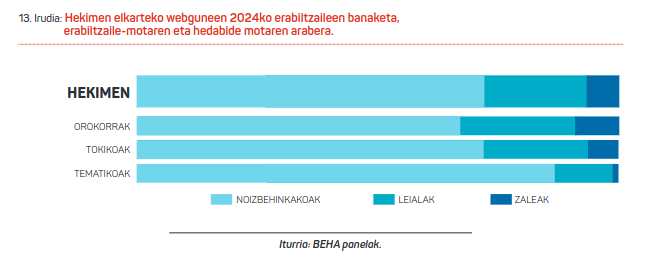
Most users have been “sporadic” by 2024, both in general and by media type. There is a difference between the groups: the general media user is the group that shows a greater tendency to return to websites again and again, followed by local and thematic ones.
To conclude, one last fact: it is a shame that through web traffic tracking tools we can not access sociodemographic data —beyond the size of the web communities to know who constitutes the audience—, but there is an indicator to close this study that is interesting among the audience tracking metrics of the Basque media, the configuration of the language of the visitors’ browsers. The average number of visitors to the Hekimae website is 13.88%, with the browser configured in Basque (12.12% in local, 18% in general and 18.75% in thematic). The data of the Basque Country published by the PuntuEUS Observatory in 2023 was 4.14%, so although the rate of users of Basque media with Basque as their default is higher, there is still a change in behavior in web browsing.
6. Some of the consequences
In this article we have made an analysis of the web traffic of the association Hekimae in 2024. Once again, I would like to draw your attention to the trends that have emerged in the last ten years.
The first highlight of the 2024 data is the number of measured media: more media has been measured than ever before. In this year’s study, 10 media outlets have been added to the analysis, going from measuring the websites of 50 media outlets of Hekimae last year to 60 this year — an increase of 20% in the measurement universe. This has been the largest year-on-year increase since the launch of web traffic measurements in 2013, a growth that has been supported by the BEHA project and BEHA panels. As a result, we have the most complete picture of digital communication so far.
The number of visas exceeded by 40 million once again, with two consecutive years of re-branding and maintaining the volume of traffic. The positive evolution shown by the 2024 data is largely due to the new media that have been added to this year’s measurement, since without this increase the total number of visits would have decreased by 1.92% —compared to the collateral ones, as can be seen in the comparison with five other media in the Basque Country (see Figure 5 and Table 6). In any case, between 2019 and 2024 there has been a significant growth in the sector, with a 42% increase in Basque media traffic before the pandemic to date, and the data for the last two years remains very close to the extraordinary data recorded in that historical annual peak of the pandemic. That is to say, this alteration caused a traffic growth that has been sustained later. It can also be seen in the data that the uncertainty generated by the deviation of the year 2020 has softened, moving to another phase it seems that the sector is going towards a stabilization union, but this will only be clarified by the data analysis of the coming years.
For the fifth consecutive year, the data on the number of mobile visits is stable: seven out of ten sessions on Basque media websites are carried out through mobile phones. However, there are still exceptions from the media; in the thematic group, for example, the computer predominates.
On the other hand, analyzing the origin of the sessions by traffic sources, the main access in the Basque media (52%), that is, mediated access, comes from search engines. Direct traffic is in second place (27%). Although social networks are gaining more and more space in the information society, the significant weight of Hekimae as a traffic driver for the media between 2016 and 2019 has been decreasing in recent years – from 30% to 14%. The Reuters Institute, whose mission is to study the future of journalism, says that the role of social networks as a traffic generator in the media here and there has been a significant decline. Facebook and X have reduced the visibility of outbound links from their social networks to the media, prioritizing both audiovisual and proprietary formats, a change that has led to a 67% and 50% decrease in traffic to the media14 in the last two years on these platforms respectively (Newman and Cherubini, 2025). The Digital News Report 2024 shows, however, how social networks continue to be key to accessing information: because only a fifth of international users directly access news websites, a direct connection that is seven points higher in us, the content is accessed by the majority through social networks, search engines and aggregators (Newman et al., 2024).
The contours of audience relations mediated by social and other networks provide for a lot of reflection; this can be a topic to collect more data and work on in the next yearbook.
In addition to the volume of web traffic, this year"s analysis also examined the depth of the audience and the size of the common websites. The number of pages viewed during the session, the average time of the sessions and the distribution marked by the total attention acquired or the typology of web users also provides significant information to better understand what is happening in the digital space of communication in Basque and to refine the analysis of the Basque media.
The analysis by type of media, grouped into general, local and thematic, shows different photographs looking at the volume of visits or the depth of visits.
On the one hand, if we focus on the relative weight of web traffic with a focus on the volume of visits, the focus is on the locals, as well as on the increase in the number of pages viewed – an increase of almost 6% since last year with 3.3 million more pages. On the other hand, when it comes to the depth of visits, the number of pages viewed per session is higher in the general media, as is the average time of sessions, to which the total annual duration of attention of users is linked. Likewise, if we also consider the size of the web communities, the nature of the type of media influences the greatness of the media of national vocation.
The metric chosen for the study can therefore change the result. So, what is the ideal metric to know the evolution of web traffic? If we want to focus on the volume, we need to focus on the sessions; the number of pages seen per session to know the depth and the time of the sessions are ideal; and to observe the size of the web communities we need to count the users. The three metrics are valuable and necessary to know the state of communication in Basque.
We will conclude this year with a quote from the Observatorio Analytics tool that will allow measurement beyond web traffic: the panel that will also collect data from social networks and other platforms in the digital environment in addition to web analytics is in the connection phase, so next year a new source of knowledge will be added to the analysis.
This year, Hekimae has carried out the largest collection of web-analytics data in Basque in history, and in 2025 the Basque media will continue to innovate; in Behategi we will continue to be partners with analytical tools and sectoral studies such as this one, among others.
7. Thank You
With the previous research works published in the Basque media yearbook, web traffic analysis was launched – and this year we are working on the development of the Behategia Analytics tool – to the members of CodeSyntax, mainly Josu Azpillaga Labaka.
Beñat Murillo Etxebarria, Hibai Castro Egia and Josu Amezaga Albizu collaborated in the data collection of 2024.
References
Azpillaga, J. (2021). Hekimen Association websites in 2020. Basque Media Yearbook 2020, pp. 121–134, <https://behategia.eus/eu/urtekaria/urtekaria-2020/> <https://behategia.eus/eu/urtekaria/urtekaria-2020/>.
Azpillaga, J. (2022). Websites of the Hekimen association in 2021. Basque Media Yearbook 2021, pp. 133–146, <https://behategia.eus/eu/urtekaria/urtekaria-2021/> <https://behategia.eus/eu/urtekaria/urtekaria-2021/>.
Azpillaga, J., & Lizarralde, M. (2017). Traffic analysis of Hekimen Web sites based on the Hekimen Analytics tool. Basque Media Yearbook 2017, pp. 81–96, <https://behategia.eus/eu/urtekaria/urtekaria-2017/> <https://behategia.eus/eu/urtekaria/urtekaria-2017/>.
Azpillaga, J., & Lizarralde, M. (2019). Analysis of the digital audiences of the websites of Hekimen 2018. Basque Media Yearbook 2018, pp. 123–140, <https://behategia.eus/eu/urtekaria/urtekaria-2018/> <https://behategia.eus/eu/urtekaria/urtekaria-2018/>.
Azpillaga, J., & Lizarralde, M. (2020). Hekimen websites in the year 2019. Basque Media Yearbook 2019, pp. 111–136, <https://behategia.eus/eu/urtekaria/urtekaria-2019/> <https://behategia.eus/eu/urtekaria/urtekaria-2019/>.
Azpillaga, J., & Mimenza, L. (2023). Hekimen websites in 2022 and the last 10 years. Basque Media Yearbook 2022-2023, pp. 137–152, <https://behategia.eus/eu/urtekaria/urtekaria-2022-23/> <https://behategia.eus/eu/urtekaria/urtekaria-2022-23/>.
The observatory. The observatory. (2023, July 6). The media has moved to Google Analytics 4. The observatory. The observatory. <https://behategia.eus/eu/hedabideak-google-analytics-4ra-igaro-dira/> <https://behategia.eus/eu/hedabideak-google-analytics-4ra-igaro-dira/>.
Mimenza, L. (2023). Analysis to measure the digital environment of Basque media: diagnosis and proposal / Data analytics to measure the digital environment of Basque media: diagnosis and proposal. University of the Basque Country UPV/EHU, <https://addi.ehu.es/handle/10810/64075> <https://addi.ehu.es/handle/10810/64075>.
Mimenza, L., Assisted by Martinez, A., We"re talking about Burreso, N., & Subillaga, J. (2024). Hekimae website audiences in 2023, a leap in analytics. Basque Media Yearbook 2023-2024, pp. 169–194, <https://behategia.eus/eu/urtekaria/urtekaria-2023-24/> <https://behategia.eus/eu/urtekaria/urtekaria-2023-24/>.
Newman, N., & Cherubini, F. (2025). Journalism, media, and technology trends and predictions 2025, Reuters Institute for the Study of Journalism, <https://doi.org/10.60625/risj-vte1-x706> <https://doi.org/10.60625/risj-vte1-x706>.
Newman, N., According to Fletcher, R., Organized by Robertson, C. I"m talking about T., By Ross Arguedas, A., & Nielsen, R. I"m talking about K. (2024). Reuters Institute Digital News Report 2024, Reuters Institute for the Study of Journalism, <https://reutersinstitute.politics.ox.ac.uk/sites/default/files/2024-06/RISJ_DNR_2024_Digital_v10% 20lr.pdf> <https://reutersinstitute.politics.ox.ac.uk/sites/default/files/2024-06/RISJ_DNR_2024_Digital_v10% 20lr.pdf>.
PuntuEUS (2023). PuntuEUS observatory, language configuration in the browsers of users in the Basque Country, <https://puntu.eus/behatokia/> <https://puntu.eus/behatokia/>.
1 HekimenAnalytics has been a project of the Basque media association HinitiativeIt was created, among other things, to collect some of the analytics of the association’s websites and work with two objectives: to analyze the evolution within the association and to use it to improve the variables of the different websites compared. The tool, which was launched in 2015 – in the case of some media the data was collected from 2012 on the basis of the retroactive nature of the configuration – and, having stopped collecting data in 2023, has been integrated into another larger tool in 2024: The Observatory Analytics. The new tool includes, in addition to web analytics, other sources of information and indicators in the digital environment and a greater number of Basque media.
2 Audience data tracking panels with Google Analytics 4, created for the Basque media from the BEHA research project (Behategia, 2023).
3 In addition to web analytics, Observatoria Analytics is a dashboard for tracking other sources of information in the digital environment, such as social networks or email newsletters. The design of the tool was launched in 2023 and its implementation is expected to be completed in 2025, only connecting some media and complementing some sources of information.
4 When a media outlet made public the new version of the website that deactivated the tracking tag, the data from that one-month gap has been estimated.
5 See the comparative note of last year’s and this year’s traffic growth metrics.
6 It could be assumed that local consumption is well above global consumption in terms of number of sessions, but considering other metrics, see Figures 9 and 11, the picture is less clear; a reflection on metrics has also been made in the conclusions section.
7 The data published by OJD Interactive are those obtained through the Google Analytics tool, collected until June 2023 through the Universal Analytics (UA) version and since July with the Google Analytics 4 (GA4) version. As a result, they are comparable to the data used in our study.
8 These are data related to the entire website, where the traffic of the Basque and Spanish versions is presented in a unified way.
9 The four largest media in this list and in the category “Notícies globals i actualitat” have been adopted to carry out this exercise: https://www.ojdinteractiva.es/mitjans-digitals-en-catala. In previous years, VilaWeb has also been mentioned, but this stopped the inspection of the OJD and, as a result, there is no data from 2019 onwards.
10 Dark social is considered, for example, that we are in social media applications when we click on a URL that is not tagged by UTM (Urchin Tracking Module), since this visit is counted as direct traffic. To prevent this from happening, you need to add some parameters at the end of all the URLs that the media shares on social networks – allowing you to avoid these incorrect data and better understand the performance of the media on the networks.
11 When counting users, different browsers are increasingly unified in web analytics, taking only one user as a reference; but we still can not confirm that it is a web user = a person, because depending on our browsing mode, the visits that we make from different browsers and devices can not identify and unify the tools to measure web traffic.
12 It would be nice, in another study, to compare the number of users and potential users of each medium; it may happen that some media reach the potential audience almost completely, while others still have a significant group that is accessible.
13 Since the design of this classification and its implementation in the BEHA panels for the measurement of the media of the association Hekimae, the year 2024 is the first year in which the analysis has been carried out (Behategia, 2023; Mimenza, 2023). It is in operation in media with data collection by Google Analytics, so the data of a media that is measured by Matomo in the general set of Figure 12 is missing.
14 According to the aggregated data from 2023 and 2024 of 1,899 media collected by the data analysis company Chartbeat (30% North American media, 30% European and 40% from the rest of the world).