

Following the studies conducted for the previous Yearbooks, one more year has been analyzed the analytics of Hekimen websites. In 2021, 35.8 million sessions were broadcast on Hekimen websites, 12% less than in the previous special year the pandemic. We have distributed the data by type of media and compared them with other websites to contextualize the evolution of the Basque media.
Introduction
In this paper we will carry out an exercise to analyze the behavior of digital media in Euskera in the network during the year 2021.
The hardest year of the pandemic, 2020, significantly influenced global digital media consumption and traffic (number of users and sessions) increased considerably in almost all cases. A similar trend occurred in digital media in Euskera and we highlight this in the work done for the previous year1.
Then we anticipated what the wager would be for 2021: “The year 2021 will also maintain this trend. It is not a slow bet (…)”. That is, to what extent did users and sessions gained in the hardest part of the pandemic stay the following year?
This question has been raised again in the mind of this analytical exercise of Hekimen websites. As in previous years, we have relied on data from Hekimen Analytics (HA)2, where metrics from the 51 websites of the association are collected.
The websites considered in this study are:
- General: Argia, Berria, Hamaika TB, Sustatu and Zuzeu.
- Thematic: Hey, Badok, Bertsolari, Dantzan, Elhuyar magazine, Gaztezulo, Hik Hasi, Irrien Lagunak, Jakin, Uztaro, Zientzia .eus and Zinea.eus.
- Premises: Aiaraldea, Aikor, Aiurri, Alea, Anboto, Ataria, Baleike, Barren, Busturialdeko Hitza, Erran, Eta kitto! Euskal Irratia, Euskalerria Irratia, Goiena, Goierriko Hitza, Guaixe, Urola Irratia, Hiruka, Ipar Euskal Herriko Hitza, Irutxuloko Hitza, Karkara, Kanaldude
A note before you start with the data. Until now, all the media collected analytical data through the Google Analytics tool, from which they automatically obtained PR. However, last year the system changed with Argia and Matomo. In the case of light, therefore, the data provided by the Matomo tool have been used, since they are comparable in users, sessions, pages, etc.
General traffic
Hekimen"s websites have been nearly 35.8 million visitors in 2021, 35,798,383, to put it in detail. An average of 98,000 visits daily.
The evolution of these data over the last nine years is shown in a table and a graph:
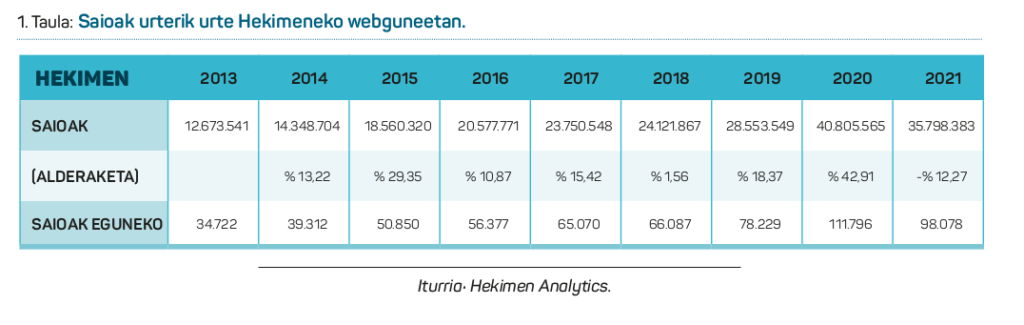
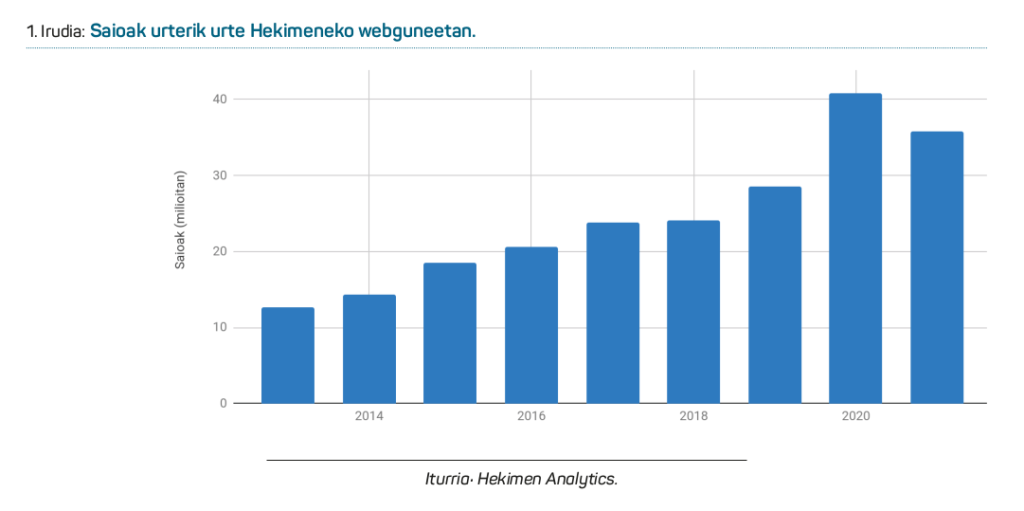
The figure of almost 35.8 million visits last year is below the figure of the previous year, as in 2020 almost 41 million sessions were counted in these media. There has therefore been a loss in visits: 12.3% loss. In the 9 years analyzed in the RP tool, there has been a decrease in digital traffic for the first time, considering the set.
Therefore, in response to the question we asked at the beginning of this exercise, we can say that not all the traffic that gained last year in the hardest year of the pandemic has been maintained.
This is also understandable, of course, because the 43% increase experienced last year was spectacular and responded greatly to the special situation experienced at one point, particularly at the beginning of the pandemic and during some months of the closure. And 2021, although special with the pandemic, has not been as intense as the previous year in terms of media activity and information thirst.
Let"s try to open our eyes a little bit.
If we look at the whole series from 2013 to 2019, that is, all the years before the pandemic, we can see that the increase in traffic has occurred every year, but in different proportions. The smallest rise occurred in the country, with 1.56%, while the largest increased by 29.35% in 2015. In these seven years the average increase was 14.5%.
By contrast, taking into account the two years of pandemic, between 2019 and 2021 there has been an overall increase of 25.36% (in the first year an increase of 43% and a decrease of 12%). That is, if distributed proportionally, there has been an annual increase of 11.97% in this series of the last two years.
In other words, the upward trend in the Hekimen media has slowed slightly over the last two years. From 14.5% to 11.9%, although a pandemic lived in the middle and expected otherwise. If the rise rate of the previous series is maintained, 37.4 million are expected in 2021, while 35.8 ‘alone’ are reached.
We could also make a general picture of each of the sessions or visits of the year 2021. These session data are shown in the following table showing the interannual evolution:
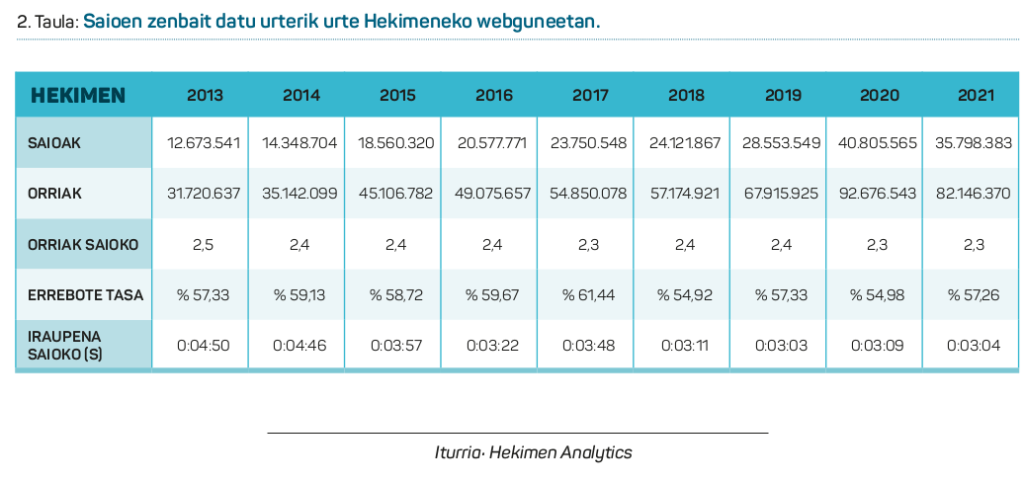
They highlight:
- The average number of pages viewed by the user during each visit was 2.3, a step of 82.1 million pages.
- The duration of each visit was just over three minutes, three minutes and four seconds.
- About 57% of the sessions have seen only one page, as it has entered and gone on the same page.
One metric as interesting as the sessions is the number of users, to see how many people or devices perform almost 100,000 sessions a day. But we can"t know the answer because we"re collecting data from different media. True to the simulation performed so far, we could say that each media gets, separately, 1.5 or 2 daily visits per user. Of course, in this issue there is a great difference between the media and others, but this average can be considered positive. Therefore, understanding the Hekimen media as a collective and assuming that this mean would be maintained, we can say that the daily insertions in these digital media exclusively in Basque are between 49 and 65 thousand different devices.
Although the number of devices and users should be taken with caution, if it is a number of visits of 35.8 million per day, per 98 thousand per year, sufficient data to show the significant weight and size of the web pages of the association.
To date, the aggregated data of all the media of the Hekimen association has been mentioned, since they would constitute a single website in Basque. But that is not the case, and there are great differences between one media and another.
It"s also interesting to take a look at the main blocks. It is recalled that the 51 Himea media are divided into general (5 media), local (34) and thematic (12).
The disaggregated table of the number of sessions is as follows:
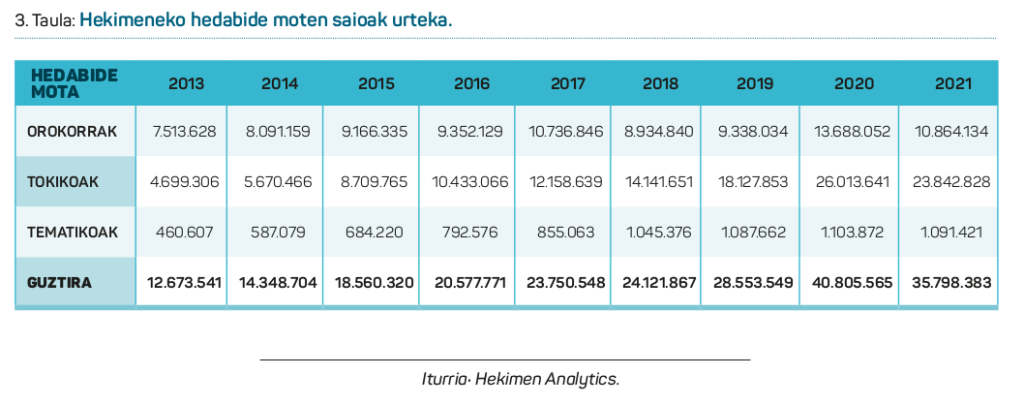
As can be seen in the table, the decrease of 2021 has occurred for all media, both general and local and thematic, which have suffered a decrease in the number of sessions.
The evolution of cigars is graphically observed:
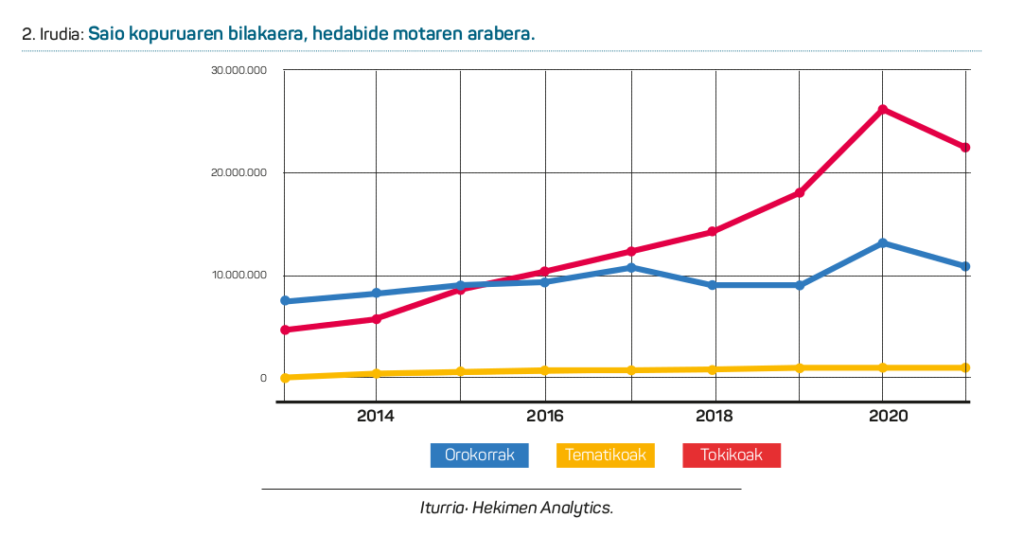
However, the downward trend has not occurred in the same proportion in all media types. Over the past year, the media in general have lost 20.6%, local media 8.3% and thematic media 1.1%. If Hekimen as a whole has fallen by 12.3%, the mainstream media has fallen above and the other two groups below.
This imbalance of sets was due to previous years, as the locals have experienced the greatest upward trend in recent years. In the first year of the pandemic, 2020, the trend broke and the general media experienced a similar increase in global sessions. Last year, however, the previous trend has returned and the general media have fallen slightly below. Or what"s the same, the locals are pulling the whole thing.
This has, of course, influenced the relative weight of each type as a whole. This could be represented in the table and chart below:
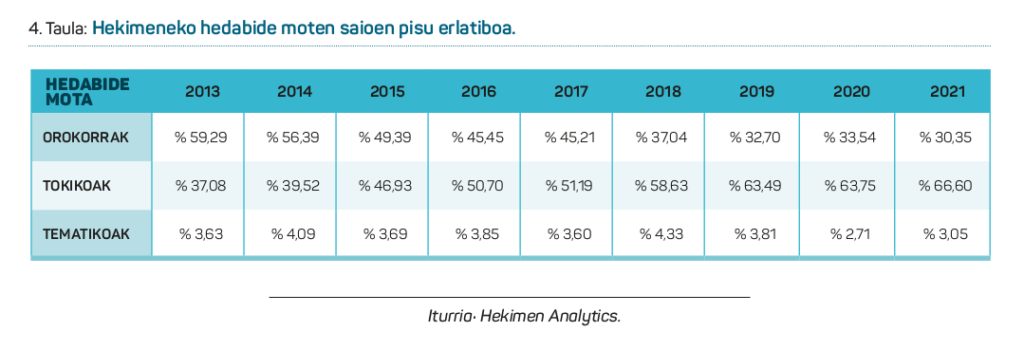
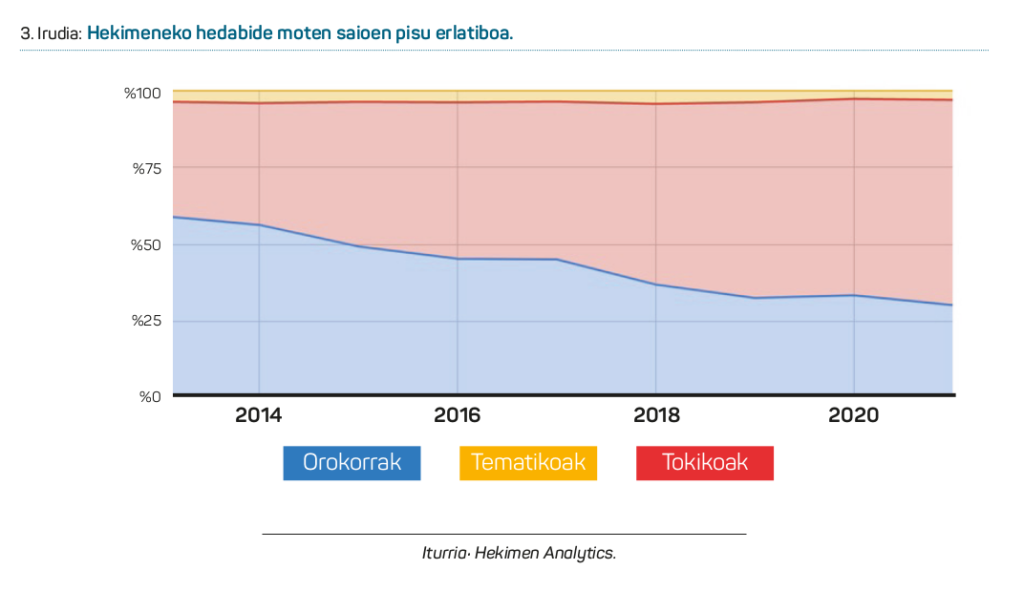
In 2013, when the PR was launched, 59% of the sessions of the group corresponded to general media, 37% were local and thematic around 4%. These proportions have been devoted in the last 9 years and now 66% of the sessions are devoted to local media, 30% to general media and the thematic percentage is around 3%. In the past year, the themes have risen slightly in terms of the number of sessions, but it is still the smallest group of the whole group.
There are not only differences between groups, but also between the media.
We have said that in the last year, 2021, traffic has been lost. But 12 of the 51 media outlets in the Hekimen group won traffic last year, keeping very well what was picked up in the hardest year of the pandemic.
The overall decline is 12.3%. The following table summarizes the behavior of each media in relation to this average, since some have had a traffic loss higher than this average and others lower.
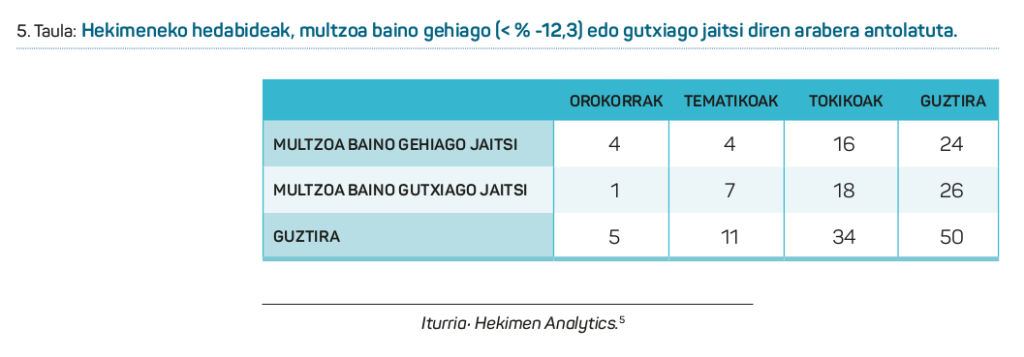
In other words, a single general media has maintained the general trend of the Hekimen Association"s media set that falls less than the overall traffic; in the case of thematic media, 7 out of 11 media has kept it better than the whole and, in the local case, almost half have walked above and below the average.
We can also observe a change of trend between groups in media size. In 2013, among the 10 major media outlets of the Hekimen Association there were 4 generals and 6 locals. Last year, in 2021, among the 10 largest media outlets there were only two mainstream media, while the remaining 8 were local.
A small comparison
In this year’s work we will carry out a comparison exercise of the Hekimen media data with others in the area, as it can help to indicate whether the data on traffic rises and decreases have been good or bad.
To this end, we will take into account the data published on the network by several media audited by OJD Interactive (Dissemination Justification Office), given that the data it provides are very comparable.
Care should be taken with all these comparisons. It would be desirable to know and compare the data of many more media to determine to what extent the network consumption of the Basque society and other environmental realities has actually changed, and to measure the evolution of Hekimen"s websites in this regard. However, most media do not provide their data openly and each is limited to reading. In this sense, one can appreciate the decision of the media that chooses to give this data openly, as well as that made by Hekimen himself.
Let"s start by looking at other Hego Euskal Herria media: We have access to data from Eitb .eus, Deia, News from Gipuzkoa, News from Alava and News from Navarra.
Data for the last five years in 7 tables and graphs, together with data from the Hekimen media set:
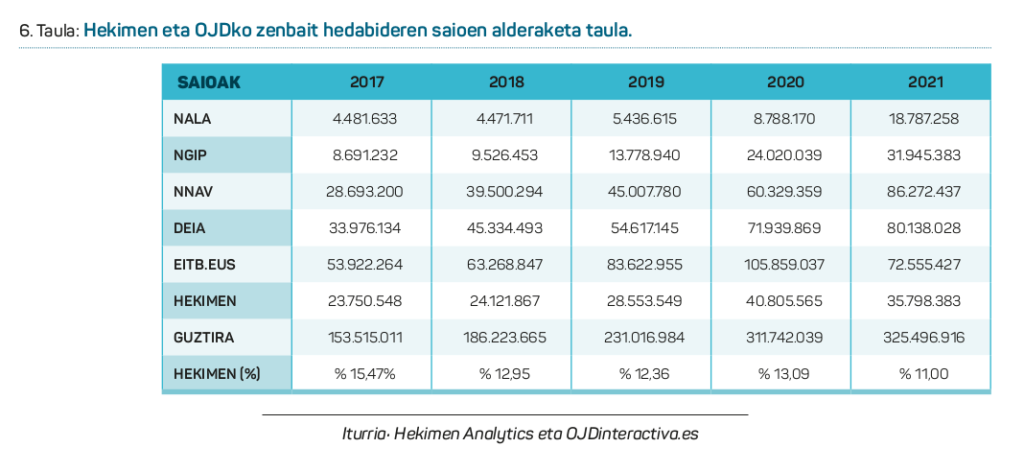
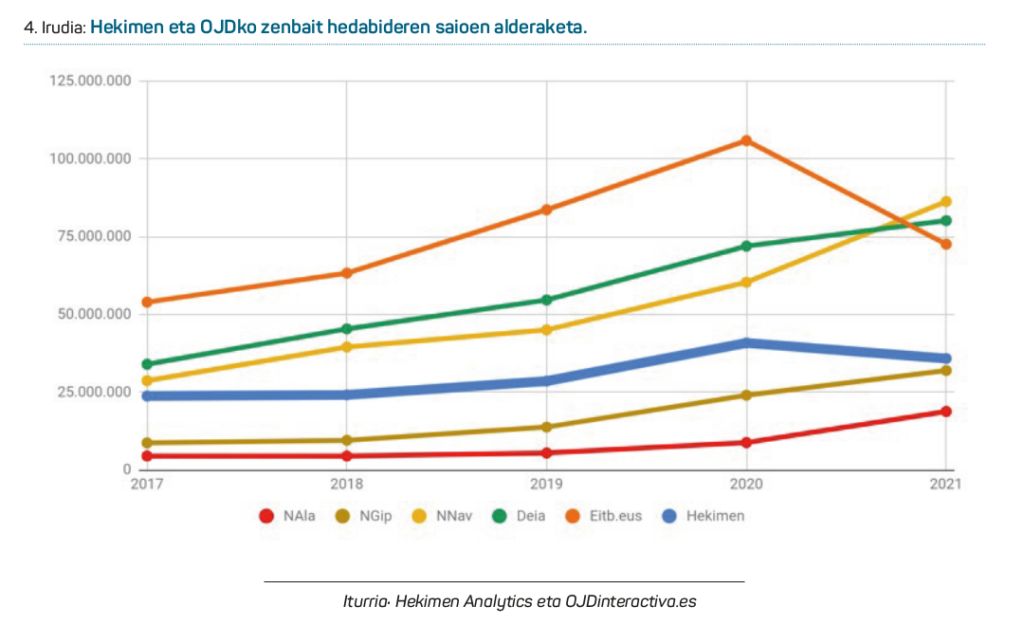
As shown in the table and in the graph, Hekimen as a whole has not been the only means of communication that has had an upward trend with data from the last five years. The rest of the media in Hego Euskal Herria have also had an upward trend, although the behavior of all has not been the same.
In addition, the previous year, the pandemic, the pandemic, has maintained this upward trend in many of them (Deia, News of Gipuzkoa, News of Alava and News of Navarra) and others (Eitb and Hekimen) have lost the traffic gained the previous year.
Within the audited set, Hekimen has been losing weight over the past five years. In 2017, traffic in this group was around 15.5% of the total, compared to 11.0% in the previous year. That is, this hypothetical set of audited media has grown more than the sum of Hekimen"s media.
If you look only at this growth, the chart below shows the evolution of each media from the number of sessions in 2017.
That is, the graph shows the increase in traffic in the coming years, placing it at the zero point of each of them.
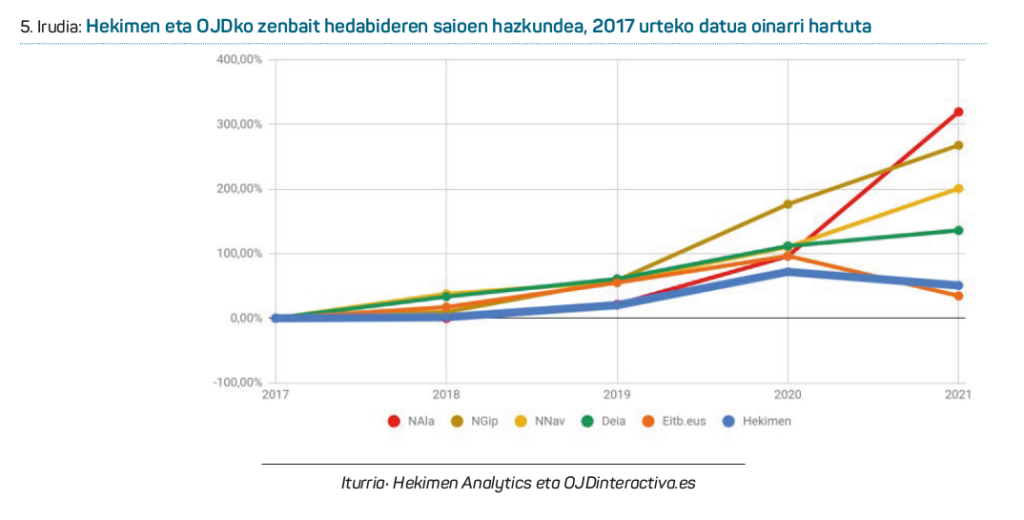
As we can see from the graph, over the past five years Hekimen Group traffic has increased by 50%, but all News Group digital media (between 319% and 136%) and somewhat less the Eitb Group (35%) have increased more than it has.
We could do the same with other media. In this section we will take part various digital media from Catalonia, dedicated to Catalan 8: The .cat9, ara.cat, rac1.cat and diaridegirona. cat.
Here are the data for the last five years in tables and graphs, along with the data from the Hekimen media set:
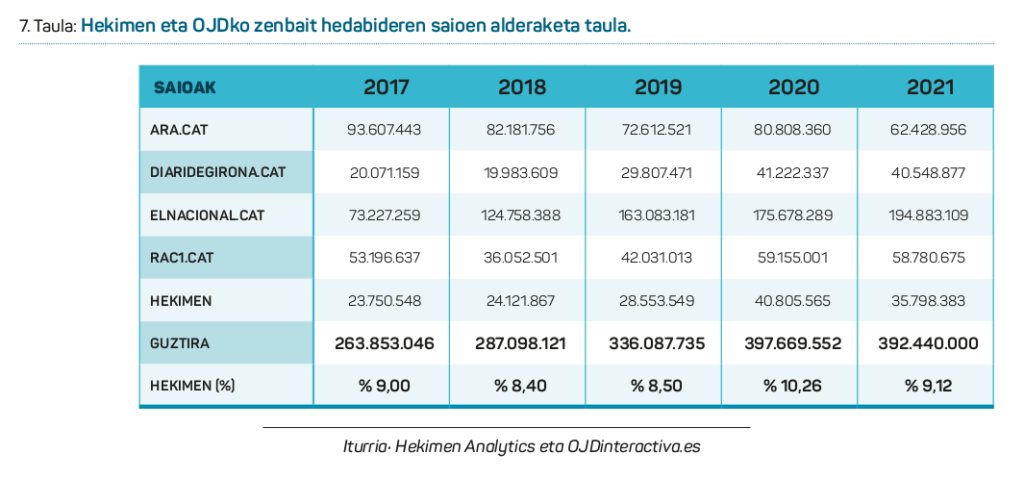
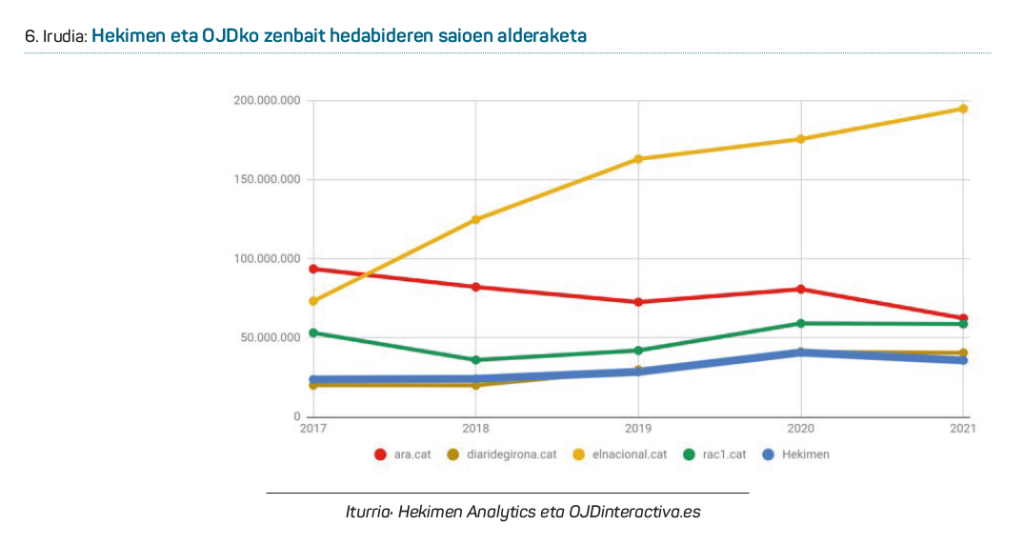
Regarding the media of the table in Catalonia, in the last year the number of sessions have decreased the media Ara.cat, Diaridegirona .cat and Rac1.cat, while the most intense traffic has increased, Elpais.cat.
Within these means, Hekimen has kept its weight on the net. In this hypothetical group, with 9% sessions in 2017, it has held a weight of 9.1% last year, although it has decreased slightly from 10.3% last year.
This is what we could see, from the number of sessions in 2017, to focus exclusively on the growth of these media.
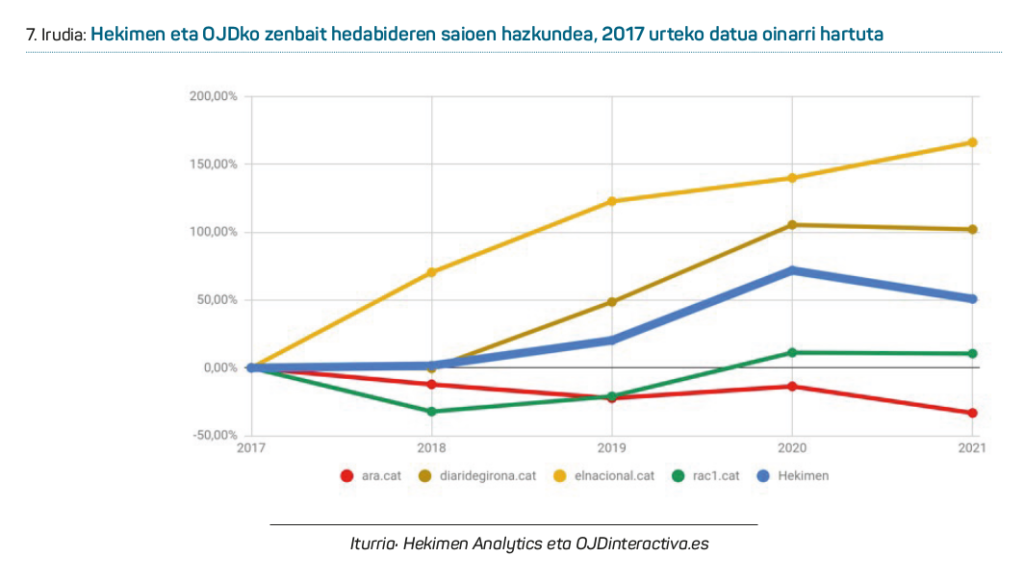
In this sense, we can observe that the 50% increase experienced by Hekimen in these five years is higher than the two media in Catalonia (Ara.cat and Rac1.cat) and lower than those of two others (Elnationat.cat and Diariodegón.cat, which increase between 166% and 102%, respectively).
To conclude
This article continues the work carried out in recent years, collecting PR data and analyzing the evolution of this hypothetical set of 51 communication media.
In 2021, traffic decreased by 12.3% compared to the previous year. The decline is not significant given the pandemic, and in the past two years there has been a 25.36 per cent increase in the same data. Last year some traffic was lost, yes, but much of what was won with the pandemic has been maintained, and Hekimen’s digital media keeps its upward trend.
Hekimen’s digital media as a whole is making a huge effort and it is noted that traffic has tripled over the past nine years. The work and outcome of the small media, which are the largest, must be valued.
But if you zoom in a little bit, there are a couple of points that you have to consider carefully.
On the one hand, the rise seems to decrease slightly. The number of meetings continues to increase overall and the overall trend continues to rise. But the upward trend is not as strong as five or six years ago. Or at least it seems that it now costs a little longer to maintain the number of sessions. Nor does it increase the time and number of pages per session.
Compared to other media in the area, we could also reach the same conclusion. The decline last year has been similar in other media, but others have kept traffic loss better. There are some indications of this attenuation and weight loss, although it would be advisable to study more and more in depth the media to ensure it.
On the other hand, the upward trend has been uneven in the media within Hekimen. The local media has doubled its traffic over the last five years, which has enabled, above all, the increase in Hekimen as a whole. There are more media in this group, including start-ups or recent digital betting, and many more reasons behind this trend. Perhaps it would be appropriate to look into them further.
Within each group, however, there are media with very different trends. There are those who have experienced a sharp increase, even in the last year, and others who have great difficulty gaining traffic in recent years.
We know that not everything is the number of clicks, that not everything can be measured only in sessions, pages and time. Media action, its impacts and possible success also require the measurement of other parameters. But in the age of the care economy, knowing the part of our network activity we offer to digital media in Basque is important, and this is what we have done.
On the right track, the RP will collect 10-year data for the following year. A decade. And it"s a decade in these accelerated times. It should give us a calm analysis of the data and draw some conclusions.
1 “The media of the Hekimen Association in 2020” Basque Media Yearbook 2021. Azpilwaukee, Josu.
2 Hekimen Analytics is a project of the Association of Basque Media Hekimen designed to collect some analytics from its websites and work with a double objective: to analyze its evolution within the association and to use the tools to improve the comparison of the variables of the different websites. It was launched in 2015.
3 See the article “Goodbye Google, hola Matomo: new measures to protect your privacy in ARGIA magazine” for further explanations https://blogak.argia/argia/2021/06/16/agur-\ -\{\{\{\{\{\{\{\} in lighting/
4 We define as a visit or session the set of actions a user performs until entering and leaving a website. A particular user can perform several sessions throughout the day on a Web page; each session has a duration of X seconds and visits the Y page in each of them. In this work we will use the session or visit, both with the same sense.
5 Measurements of a thematic medium in 2021 are not included in the RP tool.
6 The same OJD refers to the data collected by Google Analytics in the summary media measurement reports mentioned above.
7 OJD publishes five-year data on its website. That"s where all the data has been taken.
8 To carry out this activity, the four largest media in this list and in the category “Notícies globals i actu” have been adopted.
https://www.ojdminus.es/mitjans-digitals-en-catala In previous years VilaWeb has also been mentioned, but it has abandoned the OJD inspection, so there are no data after 2019.
9 The data corresponding to the Catalan website are now provided separately by the OJD and have been taken into account for this work. There may be some difference with data from previous studies for this reason.