

The media are fundamental in the Basque Digital Public Sphere (Morales i Gras and Perez de Arriluzea Madariaga, 2022), which have a cohesive role in the digital world. The dissemination of content (i.e. dissemination through formal and informal relationships established with the audience) favors the formation of collective identification and the discussion of issues of social importance. This article presents a proposal that aims to contribute to the measurement and knowledge of the hearings in the context of the Network Society (Castells, 2000).
We are still immersed in the socio-technological paradigm of Internet 2.0: Internet evolution 1 characterized by the interactivity and active participation of users with the appearance of Social Media. We are in an advanced or mature phase of this paradigm and there are no longer a few authors who speak of Internet 3.0 and 4.0, oriented towards services and artificial intelligences. In any case, the participation and interaction between users, directly and without intermediaries, are, as it is known today, one of the main features of the Internet and constitute social phenomena of great importance for the study of digital audiences. In fact, the media and, in general, issues of a certain scope, undoubtedly call their listeners to the “communities” and hire the “community managers”, if there is sufficient budget for this. However, from our point of view, there are still few investigations and hearings analyses that take into account the relationships established between media followers, and less those that are systematically conducted with a structural methodology (Morales i Gras and Perez de Arriluzea Madariaga, 2022).
Understanding how the followers of a media on Twitter are followed, creating community structures in the digital space, allows the media to adapt their tenure and communication strategy to improve their relationship with their audience in the social environment. At the aggregate level, the analysis of audiences of the main media that publish in Basque on Twitter is a lever to understand an even more important digital phenomenon, related to the digital audience of Basque in a social media like Twitter.
This study analyzes the relationships of users who follow the 7 main media in Basque related to the Twitter Observatory. The use of social media analysis techniques is intended to obtain information about the community structure and the most relevant users of each community:
- The level of connectivity between network nodes shall be analysed to determine whether they are highly interconnected or only connected to the reference medium.
- We will identify the most continuous nodes by the users of the different communities to identify the internal (nodes that follow the middle) and external (nodes that do not follow the middle) leaderships.
- In each network we will find the number of communities, that is, divisions containing different types of vocabulary with similar characteristics.
- We will assess the degree of isolation between the identified communities and check whether the subdivisions mentioned in the inner point are very important in the network.
- Qualitative characteristics of each community, such as themes of interest or degree of cohesion based on identified communities, will be analysed.
Methodology
The objective of this study is to describe the community structures derived from the relationships between users that follow the 7 main media in Basque related to the Twitter Observatory: @argia, @berria, @fm 983radio, @Gaztezulo, @Hamaika TB, @NAIZ irratia and @zuzeu. All these issues are leaders in the dissemination of content in Basque and have more than 10,000 followers, although in the end we have obtained less data, due to the possibilities of sharing users with defined third parties.
Access to the data of the followers of these accounts has been made through Twitter API 1.1, one of the official tools available at the end of 2022 when the data is downloaded. This has downloaded the following listings from the 7 selected accounts, as well as those that followed the followers of those accounts. Once the data was collected, social media analysis techniques have been implemented to synthesize and analyze the relationships of the followers of the 7 accounts. This has made it possible to obtain information about the community structure of each community and the most relevant users of each community, both for members and non-members (users closely followed by media followers, but the latter without following the media directly).
Synthesized networks are corrected and unweighted networks that reflect the continuity between media followers. This means that the edges of the networks are directional and not necessarily reciprocal (i.e. two users can stay or not), and that the weights of the edges will always be the same (i.e. you cannot follow someone on Twitter more than once, so all the edges of the network will have a weight of 1). Considering the basic structural characteristics, node and network metrics have been applied for the development of the exploratory study in predefined terms, consisting of nodes that are implemented at the individual level for each node and allow nodes to be classified and sorted, whereas network metrics inform the structural characteristics of the whole network and allow comparison between them.
According to the proposed objectives, the implemented metrics try to answer relatively simple questions and with a great capacity of information about the leaders of the network, the cohesion of the network and the community structure (i.e., which nodes of the network are well connected, which nodes are the most continuous in each community, how many communities we can identify in the network, which communities are most isolated from each other?, what are remarkable qualitative traits from each community? ). More complex indicators have therefore been omitted and commonly used by social media analysts to identify nodes with special characteristics (Mediation, Centrality of Own Vector, PageRank, etc. ). ).
Let us first look at the metrics implanted at the node level:
- Grade centrality (degree of access and exit): It refers to the number of connections or flights of a node in a network. It measures the importance or centrality of a node in the network with respect to connectivity. A high-grade node will play an important role in the network. Guided networks shall differentiate between the centrality of the degree of access and the centrality of the degree of exit. The centrality of the access degree refers to the number of links entering a node and the centrality of the output degree to the number of links leaving a node. In the context of this analysis, more attention will be paid to the degree of access to nodes and information will be provided on the number of followers among users of the communities studied.
- Community of participation: In the context of the study of networks, it is the concept of grouping nodes in communities or groups according to their connectivity pattern. To calculate the community of participation of each node, being the node metric, we will do so using the Louvain algorithm of the Gephi software, which is optimized according to the Modularity statistic. Modularity is a measure that indicates the correct structure of a network regarding the grouping of nodes. This measure will be explained later as it is a grid metric. In the context of this study, we will interpret that the nodes of a group are similar and have common interests and characteristics that we will describe from the analysis of the leaders of each community regarding the centrality of the entrance grades.
Secondly, the metrics implemented at the network level:
- Density: The density of a network is the measurement of the number of (t) depending on the number of possible connections. It is a measurement between 0 and 1; a value close to 0 indicates a network with few connections; a value close to 1 indicates a high density network. A simple and intuitive measure that allows quantifying a degree of network connectivity. In the context of this analysis, we expect to find densities closer to 0, since most nodes are not going to follow.
- Medium grade: The degree of a node is only the number of links or relationships that node has with other nodes in the network. Therefore, the average degree is the measure of the average number of connections between nodes to a network. It is a metric that, along with density, allows quantifying a degree of connectivity of a network, useful to compare different networks and characterize their structure and connectivity patterns of the network.
- Average grouping coefficient: The coefficient of grouping a node is to measure the "grouping" of the neighbors of that node. The calculation is performed by dividing the number of links in a triangle (e.g., composed of three nodes connected by two links) and this node is involved with the total number of possible triangles including that triangle. The value normalizes between 0 and 1. A high value of a node"s grouping coefficient indicates that its occupants are very connected to each other, while a low value indicates that its occupants are not very connected. The mean of the grouping coefficient is used to measure the general tendency of nodes in a network to form triangles. In the context of this analysis, the average grouping coefficient is informative regarding the trend towards local bonds in the network.
- Number of components weakly connected: A weakly connected component is essentially a subnet where all nodes can be accessed from any node. It is important to note that this refers to the dim connectivity, i.e. that there may be indirect paths of access to a node (for example, the direction of the edge will not be taken into account when assessing whether they are two accessible nodes). The counting of these components indicates the existence in a network of interconnected subgroups or communities but offline outside that subgroup.
- Grade asortativity coefficient: Grade asortivity is the measurement of the tendency of nodes with high grade centrality to connect with each other or with low grade nodes. It is calculated in the grade asortativity coefficient and is defined as the correlation coefficient between degrees at the ends of a network. A positive grade asortativity coefficient indicates that high-grade nodes tend to connect with each other, while a negative value suggests that high-grade nodes tend to connect with low-grade nodes. A positive assertiveness network implies the presence of powerful communities or groups in the center of the network (e.g., “elites” well connected to each other), while negative assertiveness tends to establish relationships between low and high grade nodes.
- Degree centralization: The centralization of the degree of access and exit are two measures that express the amount of degree of access or degree of exit concentrated in the high degree nodes of a network. It is important not to confuse this metric with the centrality of degree, since centralization is a metric that acts at the network level and not at the node level, and gives us an idea of the amount of “hierarchy” that exists fundamentally in a network. Centralisation of the degree of access corresponds to the intensity at which the degree of input of nodes is concentrated in a small number of nodes. A common measure to calculate the centralization of the degree of access is the use of Freeman"s formula. This formula takes as a reference the maximum network values and takes the value of 0 for a fully decentralised network and the value of 1 for a fully centralised network. In the context of this analysis, we understand that the centralization of degrees will reveal the strength of the leaderships in the different communities and that it is a metric in tension with the grade asortivity (for example, a centralized network must have a disortative network in which the high-grade nodes relate to the low-grade nodes).
- Community distribution and modularity: The Louvain algorithm shall be used to identify the Community distribution of the network (e.g. the node participation community and the resulting node structure). The Louvain algorithm is a tool used to divide and divide a network into groups of nodes (called communities). This grouping is performed according to the proximity of the relationships between the nodes of these nodes blocks. The objective of this distribution is to find organizational models in the network. In order to achieve this, the algorithm uses Modularity and measures the correct structure of the network regarding the grouping of nodes. Modularity is calculated by a mathematical formula. This formula compares the expected number of times within a community to the actual number of times within a community. In the case of the Louvain algorithm, it is about finding a network division to maximize the value of modularity, which implies the search for a division in which nodes within a community are intimately related to nodes from other communities and have little connectivity. In the context of this analysis, we will look at the value of Modularity and the number of communities identified.
Data are then analysed. First, a comparative analysis between networks will be performed based on the above mentioned metrics. To do this, we will use a correlation matrix with the Pearson correlation coefficient, which can be consulted in its entirety in Annex 1. Secondly, we will provide a qualitative description of each community, describing the types of vocabulary that govern the communities in the different networks. Analysis will be implemented with Jamovi package (The jamovi project, 2021) for R (R Core Team, 2021), NetworkX packages (Hagberg, Swart, and Chult, 2008), with Pandas (McKinney et al., 2010) and the Seaborn package (Waskom, 2021) for Python 3 (Van Rossum and Drake, 2009) and Gephi software (Bastian, Heymann and Jacomy, 2009).
Results
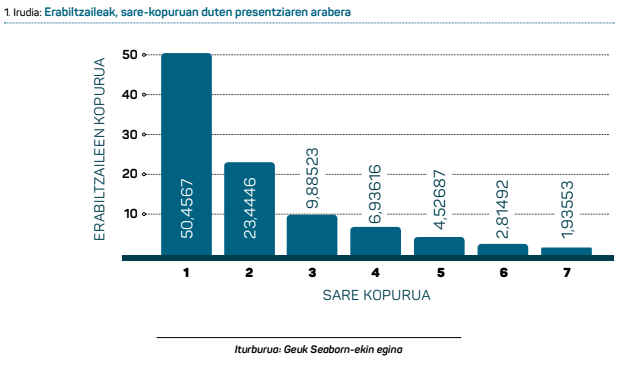
The 7 networks analysed are very similar, all of which represent the same type of network (fan networks of a Twitter account), based on very similar issues (i.e. the Basque media). A first interesting finding is that only 50.5% of nodes are in a single network (Figure 1), which means that 49.5% are in two or more of the seven networks. There are therefore seven networks with a clearly common audience (the Basque media audience), which allows us to foresee significant similarities in the structure of the community, both quantitatively and qualitatively.
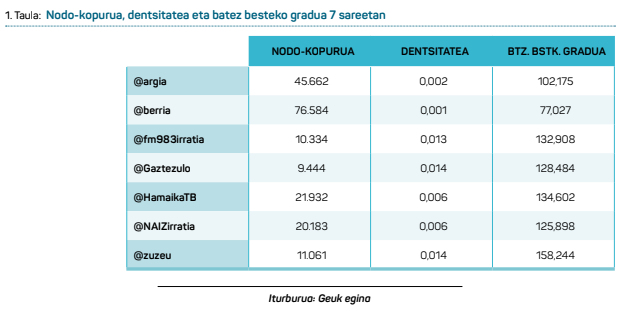
The following metric correlation matrix will be used for the analysis of the structural metrics of the network. The following table shows basic network size and cohesion metrics: number of nodes, density and medium grade (Table 1). The largest network is Berria with 76,584 nodes and the smallest is Gaztezulo with 9,444. In the context of this analysis, the size of the network (i.e. the number of nodes) seems to be a major variable, as it is significantly, negatively and very powerful correlated with density (r = -0.86) and average grade (i.e. -0.92). This means that larger networks (@berria and @argia) have less cohesion than smaller ones. On the other hand, the density and average degree are correlated significantly, positively and very powerful (0.81).
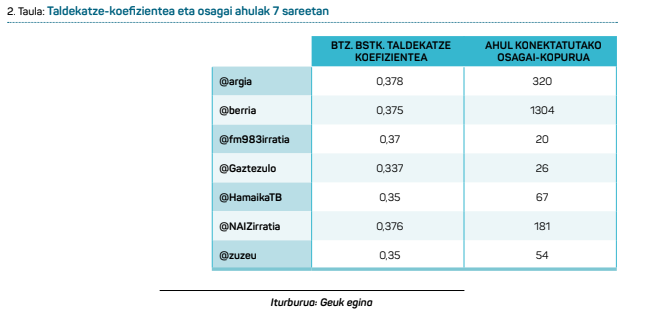
The following table shows the cohesion metrics, the average grouping coefficient and the number of jobs weakly connected (Table 2). The average grouping coefficient remains virtually constant in the seven networks. This information is very important because it reinforces the idea that all networks share a common audience and act similarly at local level: nodes tend to know one third of the population (between 33.7% and 37.8%). As it remains virtually constant, this metric does not correlate with any other metric. Conversely, the number of weak components of the networks is significantly, positively and vigorously correlated with the number of nodes (i.e. 0.95) and the average grade (i.e. -0.85).
The following are analyzed the measurement of grade asortivity and degree centralization (Figure 3). The seven networks show a slightly disortative trend, that is, anti-asortive, but in no case are they more than a tenth of 0. This means that the degree of nodes is not a determining factor when guiding the relational behavior of the network: we are not dealing with a network separated by a central elite or an extreme hierarchy. However, the figures for centralisation of the degree of access are quite high, in some cases higher than those. In contrast to the above figures, the centralisation of the output level is relatively low in the network, with a maximum value of 0.17 for Zuzeu.
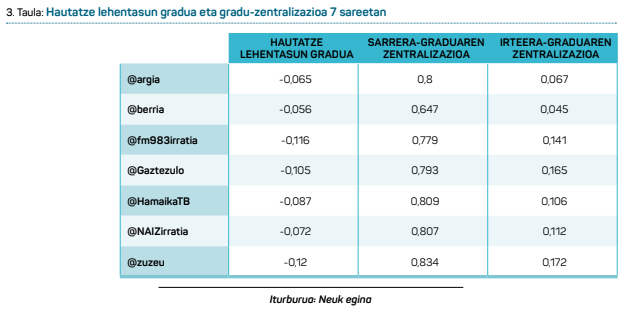
Gradual asortivity correlates significantly, positively and vigorously with the number of nodes (i.e. 0.84), and negatively with other metrics such as density (i.e. -0.95), average grade (i.e. -0.85) or centralization of output grade (i.e. -0.93). Smaller and cohesive networks therefore tend towards disortativity. They also tend to have a greater centralization of the degree of exit (i.e., a characteristic symptom of being very active users in continuity with others, which can be understood as an enthusiasm for commitment and cohesion and growth towards the community), but curiously this metric does not seem to correlate access with the centralization of degree.
The centralisation of the introductory grade, on the other hand, has a significant, negative and vigorous correlation with the number of news items (i.e. -0.83) and the number of users weakly connected (i.e. -0.93), while it has a positive correlation with the average grade (0.84). This means that network leaders are stronger in small networks (i.e., with the exception of Argia, which is a large network but with great leaderships), when the number of vulnerable components is small and nodes are consistently maintained, being a measure that shows great cohesion, so it is suggested that the leaders of the analyzed networks also play an important role in the cohesion of the network.
Finally, the centralisation of the degree of output, in addition to the grade asortivity, has a negative correlation with the number of nodes (i.e. -0.91) and the number of jobs weakly connected (i.e. -0.78), and positive with the density (i.e. 0.98) and the average grade (i.e. 0.89). The presence of active minorities in other users is higher in more cohesive networks (i.e., smaller, with fewer components, denser and more related to management). Although the analysis based on the Pearson correlation coefficient does not allow us to draw causal conclusions, in this case we consider that the data point to the hypothesis that it is precisely these active minorities that generate more cohesive networks, thanks to their intense sensory activity oriented to the consolidation and growth of the community. An active minority could then be one of the keys to media success in Basque on Twitter and the Internet in general.
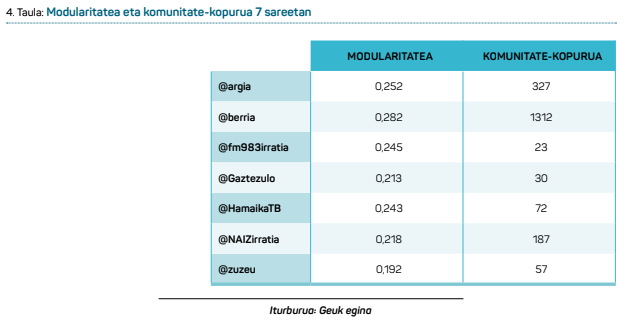
The table below shows the Modularity figures and the number of communities identified in each network using the Louvain algorithm (Table 4). In general, we can say that the Modularity figures are very low. Metric creator Mark Newman (2004) himself states that the values below the Modularity statistic indicate community structures of little importance. However, it would not be appropriate to interpret this “low significance” as a p-value of a statistical validation test; any Modularity value above 0 but below 0.3 suggests that the clusters found are very similar and share multiple links with the other indicators analyzed so far. As for the number of communities, there seem to be manageable figures, except for Berria, which has 1,312 sub-communities.
Although generally small, the Modularity figures show a significant, strong and positive correlation with the number of nodes (i.e. 0.82) and negative with the average grade (i.e. -0.87), the centralisation of the degree of access (i.e. -0.80) and the degree of exit (i.e. -0.87). Larger communities tend to have a greater modular structure, less node relation, weaker leadership and less active minority and, therefore, greater differentiation between network user profiles.
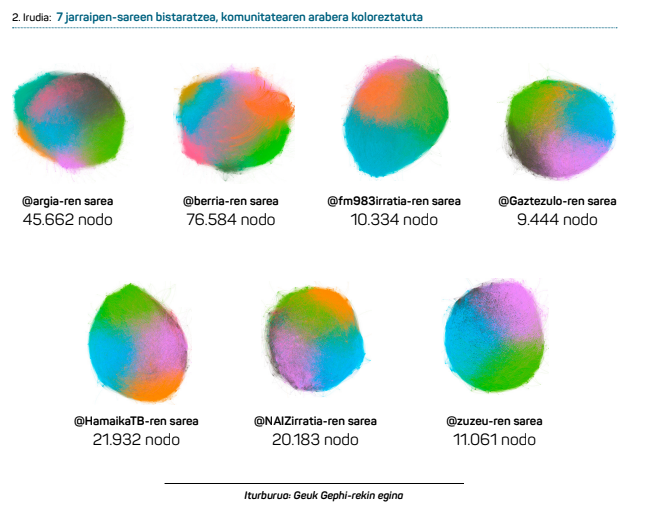
The number of communities, in turn, correlates significantly, strongly and positively with the number of nodes (0.95) and the number of weak elements (1.00). And it does so negatively with the average grade (0.87), the centralization of the degree of access (0.93) and the degree of exit (0.78). Then we have more communities when networks are larger, have more vulnerable components (i.e., the Louvain algorithm tends to consider many vulnerable components as a community) and, as in the previous case, when leaders are weak and minorities are not very active in continuity with other community members. The following visualizations have been synthesized from the identified communities (Figure 2).
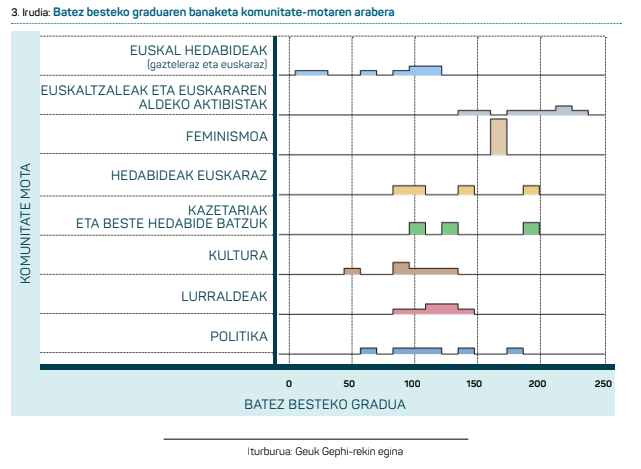
The types of community that exist in each network are described below. To do this, we will first analyze the types of community existing in each network. In total, there are 8 different types of community that are distributed differently in the studied networks. The following are the different types of community found in the networks, locating them according to their cohesion levels, according to the distribution of the average degree of community in each type of community (Figure 3).
- In all networks we find a community headed by the Basque media, but not necessarily Basque. We are, Naiz and many things related to EiTB appear in these communities. Other times, but not so much, the external leaders of the media in Basque Spanish, such as El Diario Vasco or El Correo, stand out. The average level of these communities is below the average of the network and suggests that users of this network are followers of various Basque media and that the Basque country is not a priority when deciding who to follow on Twitter. These communities are not as cohesive in all networks, probably because of the diffuse and generic nature that binds users, which seems to be their interest in the current information.
- In six of the seven networks (@fm 983irratia, all the others), we have also found a community led by bertsolaris, Basque journalists, bloggers and language activists, which we have called “Euskaltzales and Basque activists.” This type of community is the antithesis of the previous one in relation to group cohesion, and stands out for its average levels, which tend to remain above the average of the network. The existence of such specific and cohesive communities in most networks (@fm 983 in the case of radio, although they coincide with the media community in Basque), gives solidity to the arguments presented earlier regarding the decisive role of the active minorities of the media in Basque.
- In five of the seven networks (except in all of them @Gaztezulo and @NAIZ) communities are users of the same territory, the main explanatory thread of the cluster. They are communities with users from Navarra, Iparralde, Araba, Gipuzkoa and Bizkaia and the media show their special connection with the territories of the Basque Country. These clusters are therefore cohesive and do not show a tendency to stand below or well above the network average.
- Even in five of the seven networks (i.e. all but @NAIZ Radio and @zuzeu) we have clusters, led by music groups or by entities related to culture in Basque. Normally, these clusters are not as cohesive as the Network average as they revolve around a more or less diffuse concept, and they may be the secondary or tertiary interest of many users with much broader interests, who do not follow the other clusters in particular.
- The networks @argia, @berria, @NAIZ irratia and @zuzeu highlight one or two communities around the political groups: Mainly the Abertzale Left and the Socialist Movement. Sometimes the members of the PNV or the Basque Government also stand out in these communities, but in general they are external leaders, as the members of the communities remain many, but are not part of them. These communities have different levels of cohesion, but they flee from extreme values.
- The networks of @argia, @berria and @fm 983irratia highlight the specific communities for other media in Basque. It is a community that sometimes overlaps or is confused with the Basque and activist community (for example, in the case of @fm 983irratia, they eventually merge) but that indicates a degree of cohesion closer to the media. These are therefore mid-term hearings between the cohesive minority and the generic magma of followers interested in various issues.
- In addition, three out of seven communities (i.e. @argia, @Hamaika and @NAIZ irratia) have communities led by journalists who publish in more than one media, as well as state-oriented media such as Public or El Salto. These communities have levels of cohesion similar to the network average.
- Finally, the internal and external leaders of a community are mostly involved in the feminist movement. The community has similarities with political communities, even in terms of cohesion, and is among the most cohesive of the network.
Discussion
In our study we analyzed seven networks of communication channels in Basque among the followers of a Twitter account. One of the first discoveries is that only 50.5% of nodes are in a single network, which means that the remaining 49.5% are in two or more networks of the seven. This is a very large number, so we can conclude that among these networks there is a common audience, so it is reasonable to expect significant similarities in the representative Community structure of each media.
For the analysis of the structural metrics of the networks, a correlation matrix between the metrics presented in the article will be used. One of the conclusions obtained is that the network size, measured in number of nodes, is negatively related to the density and average degree of networks. This means that larger networks have a lower level of cohesion than smaller ones. It is not a surprising discovery, generally aligned with the Graph and Networking Theory of the Real World (Anderson, Butts and Carley, 1999), but rather important, as it allows us to lay the foundations for what we are going to return to later: the importance of cohesive and active minorities in Basque media audiences.
In addition to analyzing the size and cohesion of the networks, cohesion metrics have been studied, such as the mean of the grouping coefficient and the number of weakly connected components. The results show that the average of the grouping coefficient is practically constant in the seven networks, which reinforces the idea that all networks share a common audience and act similarly at the structure level.
The results obtained in the metrics of asortivity and degree centralization have given rise to results that at first glance seem contradictory to each other, but accurately describe a complex scenario, worthy of explanation. The results of the Metric Asortativity showed a slightly disortative trend in the seven networks analyzed, but not strong enough to affirm that the network nodes tend to be related mostly to nodes of a different level than their own. The level of nodes is not a determining factor in the relational behavior of the network, but it would not be correct to state that it has no influence. In other words, this suggests that there is no central elite or extreme hierarchy in networks. However, the figures for centralization of the degree of access are quite high, as in some cases they exceed the records, which suggests the importance of the leaders of the network and the role they play as “adhesives” integrators of it. These two results, those of the grade asortivity metric and those of the access grade metric centrationseem to cancel each other out; to better understand one another, it is necessary to analyze the centralization of the degree of exit.
If the trend towards disorativity is not very pronounced, this is due to the fact that the centralisation of the degree of output in the networks is small, with a maximum value of 0.17 in the case of Zuzeu. Although the number of outbound centralization is small in all networks, it is higher in networks with fewer nodes. The metric also has a positive correlation with cohesion metrics, such as density or average grade. The results of this metric suggest a general tendency to follow the same user volume, but also the existence of groups of users especially active in continuity with others, which can be interpreted as an enthusiasm for commitment and cohesion and growth with the community. Therein comes the importance of cohesive and active minorities for the Basque media, in this case the smallest.
The modularity figures obtained in the seven networks studied are, in general, small. It is important to note that, in the context of the SSA, the fact that a Community structure is not significant in mathematical terms does not mean that it is not phenomenologically significant. In this case, the communities share multiple links, which coincides with the other indicators analyzed in the analysis, which have shown high cohesion and high similarity between users.
Regarding the number of identified communities, the results show, in general, their usefulness, except for the Berria network, which has many different subcommunities. In addition, the results indicate that the number of communities correlates positively with the number of nodes and the number of vulnerable components, and negatively with the average degree and centralization of the degree of access and exit. This suggests that communities are more abundant in larger networks, with more vulnerable components and with less leadership.
Regarding the type of community, after qualitative analysis, 8 types of community were identified, divided into clusters. At the forefront of these communities are the Basque media not necessarily in Euskera, bertsolaris, journalists in Euskera, bloggers and language activists, users of the same territory, musical groups and institutions related to the world of culture in Euskera, political groups, other media in Euskera and journalists who publish in more than one medium, including the State guidance media and the feminist movement. The cohesion of these communities varies and some are more cohesive than others. The most cohesive communities found are those led by Euskaltzales and Basque activists. These communities have levels of cohesion above the average of networks, suggesting that their members have very similar interests and characteristics and are very much involved with each other. On the other hand, the communities that show the lowest level of cohesion achieved are those led by the Basque media, but not necessarily the Euskaldunes. These communities have a degree of cohesion higher than the average of the network, indicating that their users have diverse interests and objectives and are not closely involved with each other.
Conclusions
With this research we wanted to show the importance and potential of taking into account the relationships between followers in the measurement of the digital audience and, especially, in the Twitter network so important for the media. The analysis of networks of communication channels in Basque among the followers of a Twitter account has allowed to deduce the existence of a common audience among the networks and, therefore, it makes sense to expect significant similarities in the representative structure of the community of each media.
The results obtained in our study suggest the existence of a single audience for the Basque media. This is reflected in the high proportion of nodes appearing in more than one network (49.5%), indicating a common audience among these media. Moreover, the remarkable similarities in the Community structure of each media, measured through structural metrics, reinforce this idea. The importance of knowing this audience and taking into account the relationships between its followers in the measurement of the audiences is evident, as it is considered that cohesive and active minorities are of vital importance in this audience. It is important to pay attention to these minorities in order to work on the content successfully disseminated, while at the same time working to increase cohesion on the periphery of the network. This would allow the media in Euskera to develop strategies to maximize their impact and achieve an increasingly broader and committed audience.
In our opinion, community analysis can be especially important when combining it with content analysis, as it would allow us to see what is most talked about in each cluster, what content is most successful or how new formats are adopted. This would allow a better understanding of the priorities and needs of the audience, adapting the contents and strategies to achieve greater dissemination and effectiveness. In addition, content analysis can help identify the trends and relevant themes of each community, which would allow the media to generate content that meets the needs of viewers, both the most committed and cohesive and the most peripheral, and their engagement, which increase visualizations and readings.
Finally, we would like to point out that many of the limitations of the study, such as the Centrist approach or the static treatment of a dynamic phenomenon, can be resolved by incorporating more data sources and through a real-time information capture and processing system. We believe that the analysis carried out has great replicable potential and can allow us to observe changes that will occur safely over time. In this respect, it would be very interesting to be able to constantly monitor topics of interest, analyzing the passage of time and the changes in the Community structure resulting from the decisions of the media. Thus, it is possible to obtain a more complete view of the media audience in Basque and to make informed decisions about how to access it, to increase the dissemination of the contents of the same media.
References
Bastian M., Heymann S. and Jacomy M. (2009). “Gephi: an open source software for exploring and manipulating networks.” International AAAI Conference on Weblogs and Social Media.
Castells, M. (2000). The age of information. The network society. Madrid: Alliance.
Hagberg, A. Swart, P. and S Chult, D. (2008). Exploring network structure, dynamics, and function using NetworkX.
McKinney, W (2010). “Data structures for statistical computing in python.” In Proceedings of the 9th Python in Science Conference (Vol. 445, pp. 51–56).
Morales i Gras, J. and Pérez de Arriluzea Madariaga, A. (2022). Cartography of the Basque Digital Public Sphere. Structural research and dissemination of information on social networks (des) with social influence. Vitoria-Gasteiz: Central Publishing Service of the Basque Government.
Newman, M. R. (2004). “Fast algorithm for detecting community structure in networks.” Physical review E, 69(6), 066133.
R Core Team (2021). A: A Language and environment for statistical computing. (Version 4.0) [Computer software]. Retrieved from https://cran.r-project.org. (R packages retrieved from MRAN snapshot 2021-04-01).
The jamovi project (2021). Jamovi. (Version 2.2) [Computer Software]. Retrieved from https://www.jamovi.org.
Van Rossum, G. and Drake, F. L. (2009). Python 3 Reference Manual. Scotts Valley: CreateSpace.
Waskom, M. L. (2021). “Seaborn: statistical data visualization.” Journal of Open Source Software, 6(60), 3021.